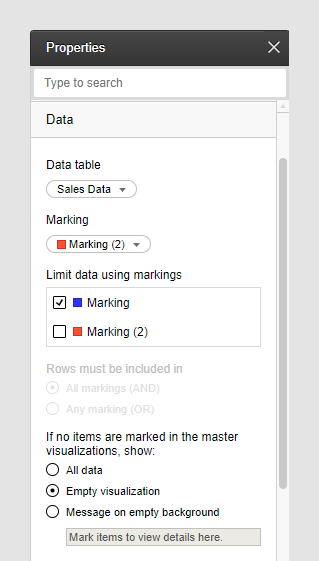
Specifying what to show when no data is marked

In a visualization, you can mark data that you are particularly interested in, and then examine it separately in details visualizations. In such details visualizations, you can specify what should be shown when no data is marked in the master visualization.

For information about details visualizations, see Drilling down into details.

The following options are available. You can show
  • all data
  • an empty visualization
  • a message on an empty background.
Since different visualization types have different available attributes, it varies between the visualization types exactly what will be shown using the different alternatives. The images below show the three options in a bar chart.

All data

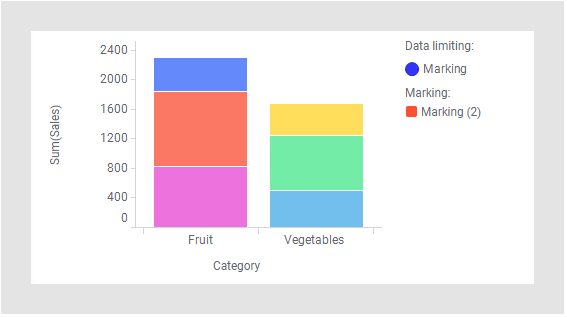
The details visualization will show all the data from the master visualization until you mark something.

Tip: If you use the All data option, you can view the marked data in the master visualization itself. For more information, see Zooming into visualization details.

Empty visualization

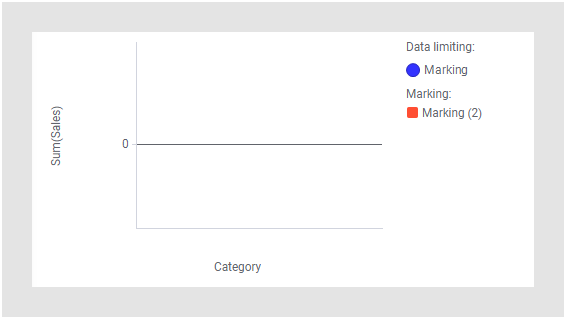
Unless you mark anything, no data will be shown in the details visualization. Where applicable, axes and scales are displayed.

Message on an empty background

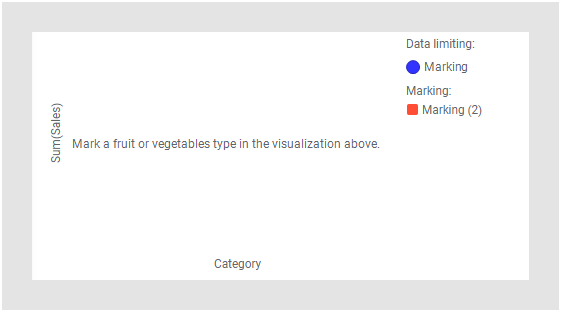
Unless you mark anything, no data will be shown in the details visualization. You can display a message to let anyone know in which visualizations to mark items to view details. Where applicable, axes and scales are displayed.

Prerequisites

The Limit data using markings setting in the Data section of the visualization Properties is used.

Procedure

  1. Right-click the details visualization, and select Properties in the opened menu.
    The Properties pop-over is displayed.
  2. Click Data.
    The Data section is displayed.
  3. Specify what to show in the drop-down list If no items are marked in the master visualization, show.
    If you select Message on empty background, enter the text to be displayed in the field.