LastPeriods()
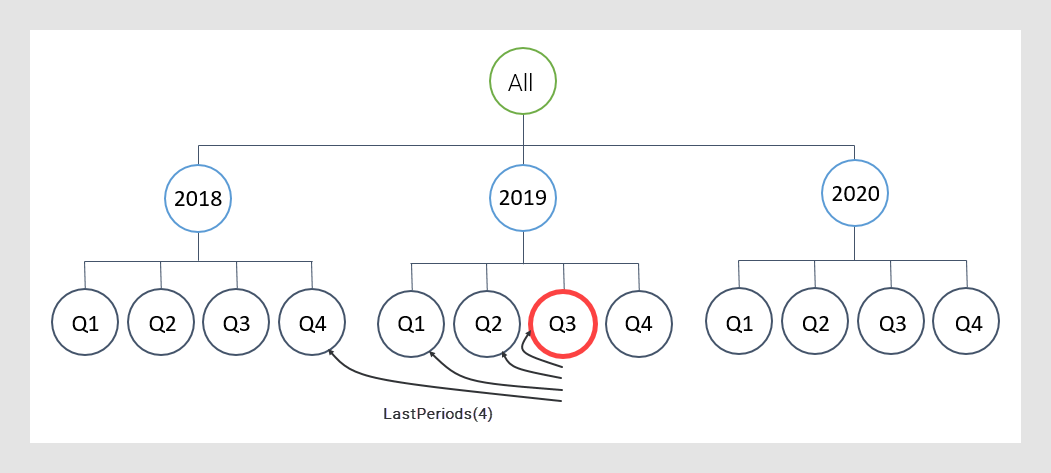
You use the LastPeriods() navigation option, when you want to reference a set of nodes, prior to and including the current node within the same level of the hierarchy. It is up to you to specify how far to look backwards in time.
For example, if you specify LastPeriods(4), as illustrated below, the method will include the current node and the three prior nodes.
The method is useful in answering common business questions, where information backwards in time is requested, for example, when calculating averages moving over time.
Example
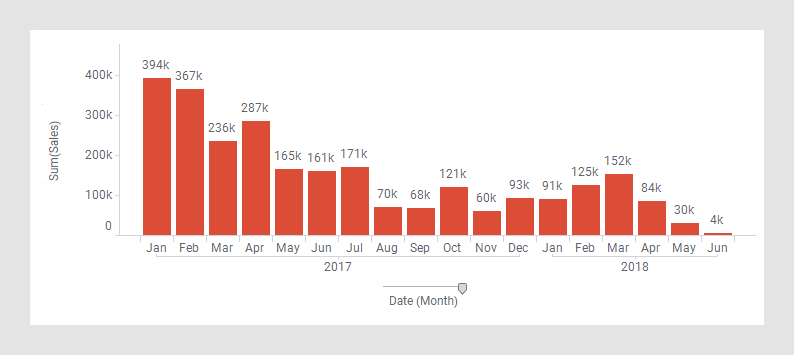
The bar chart shows monthly sales values for a period of time. Assume you want to view trends in average sales values, looking backwards three months at a time.
Apply the expression below. It sums the sales for three nodes (the current node and its prior two nodes), and divides the sum by 3, that is, calculates the moving average that spans over three months.
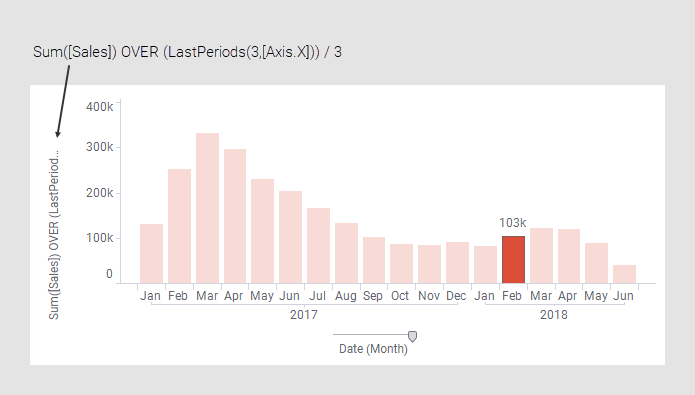
For example, the marked February bar, 103k, is the average of sales in three months, December, 2017, January 2018 and February 2018 ((93k+91k+125k)/3.