Aggregating coordinate-based locations values
If geographic coordinates are available in the data loaded into a marker layer in the map chart, each marker is positioned at its coordinates. But you may not be interested in separate markers; instead an aggregated value representing multiple markers may be of interest.
The most common way to position markers is by geocoding. Then you can aggregate values by moving up one level in the specified geographic hierarchy. For example, if the columns you use for geocoding are Country > City, you simply remove the "City" column to get a marker representing the aggregated value for all the cities in each country.
If you want to aggregate values for markers positioned using coordinates, first check whether geocoding can be used, that is, switch to Name-based (geocoding) in the Properties, the Geographic location section. However, this option requires that columns with geographical names are provided. If no such columns are provided, see the example of a possible solution below.
Example
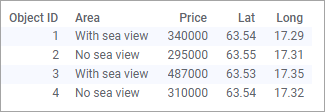
The data contains house prices for four different objects. Two of the objects are located by the sea, and two of them are further into the land. Note that no columns with geographical names are available, only coordinates.
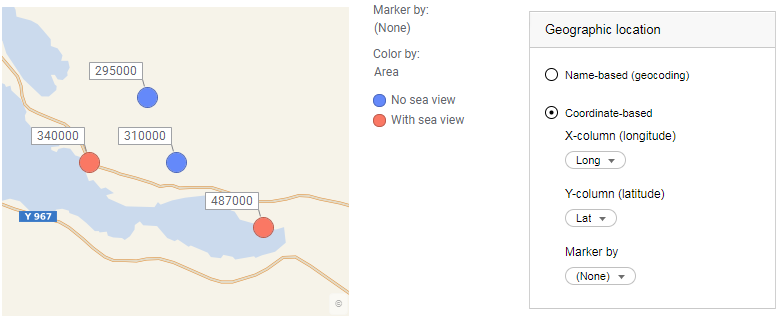
Below, the data is loaded into a map with the objects placed at their coordinates (labels show the prices):

Assume you wish to compare the average price of houses with a sea view, to houses without. Geocoding is not an option, since no column contains geographic names.
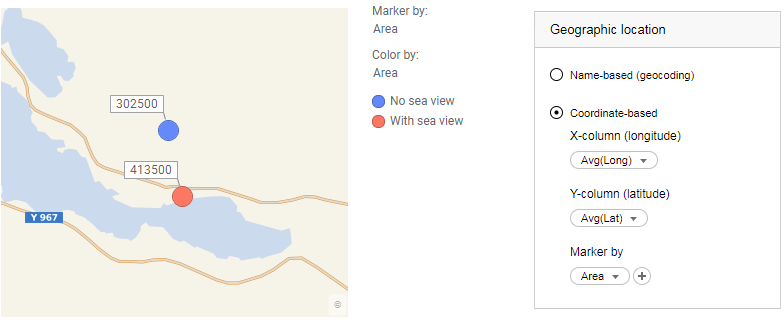
Instead, select "Area" on the
Marker by selector to aggregate values per "Area" type. Also the X- and Y-column values must be aggregated. Otherwise each of the four coordinates will be displayed. The best aggregation method is probably average as shown in the
Geographic location section below:

Note the labels have been specified to show the average price. You specify labels in the Labels section in the
Properties.
