Showing the difference between the values in two columns
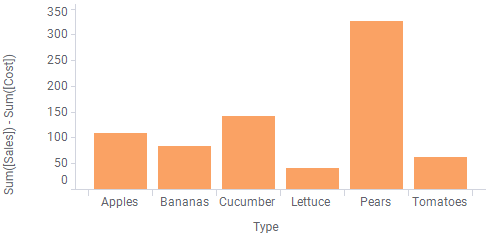
With custom expressions you can do just about anything with the columns in your data. The example below shows how you can use custom expressions to calculate the difference between a Sales column and a Cost column to directly show the Profit for different products.
Note: Because custom expressions work on the filtered rows, you will get different results depending on how you filter your values.
The example data looks like this:
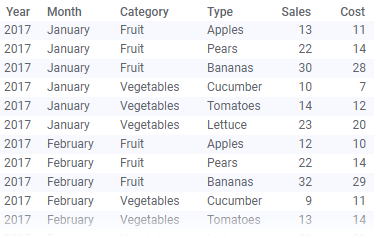
One column contains the sales price and another the purchase cost for each product group and month.
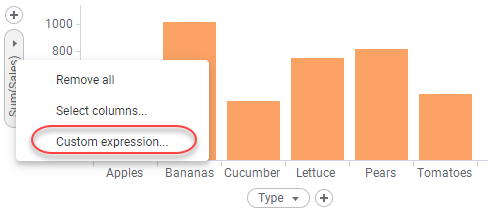
Procedure
Copyright © Cloud Software Group, Inc. All rights reserved.