Using Historical Data for Activity Duration

The following was deferred in V1.1

TIBCO Business Studio allows you to specify the interval of case starts using mathematical distributions. For example, in a manufacturing environment, a new work piece might arrive on a conveyor belt every five minutes. When simulating this in TIBCO Business Studio, on the simulation properties of the Process, select a Distribution of CONSTANT and specify five minutes.

However for more complex simulations, deciding which distribution to use can be difficult. Furthermore real data often exists that is ideal to use. TIBCO Business Studio allows you to import case start data from an Excel spreadsheet. In addition to the data about the interval and timing of case starts, you can import simulation parameters and parameter values.

Warning: Using imported data for parameters and parameter values can have unintended effects on Gateways and weightings later in the Process. For example, suppose a Process has two Gateways: one that uses imported historical data and one later in the Process that does not. Any weightings assigned to the first Gateway are ignored and the flow is taken from the actual imported data. The flow at the next gateway is generated from the weighting set in the simulation parameters (for example, 50:50), but because it is randomly generated and receiving actual data that is not random, the distribution after simulation may not be 50:50.

Create the Import File

The first step is to obtain the data you want to import. The format of the file that you use for the import is as follows:

  • Excel spreadsheet - The first row of cells corresponds to the parameter names. Each column under the first row represents the parameter values you wish to import.

    Should we specify that the parameter names have underscores as formal parameters can’t have spaces?

    Import the Data

To import historical case data, do the following:

Procedure

  1. Right-click the Package that contains your Process and select New > Other.
  2. Expand BPM and select Historical Case Data.
  3. Select the appropriate file type (Excel or Text File) and click Next.
  4. Browse for the file and click Load, then click Next.

    The simulation parameters are displayed as columns and each column displays the parameter values.

    Select the parameters you want to import and click Finish. This creates a file with the extension .realdata.

    Associate the Imported Data with the Start Event

  5. Go to the Properties view of the Start event and click the Simulation tab.
  6. Set the Number of Cases.
    Note: If you set the number of cases to more than are contained in your imported data, only the Time simulation parameter is used. If you set the number of cases to equal to or less than the number of cases in your imported data, both the Time and any other parameters are used.
  7. Select EMPIRICAL as the Distribution.
  8. Browse to select the .realdata file that was created from your imported simulation data.
  9. Right-click the Process and select Prepare Simulation. This automatically generates the names for the simulation parameters and the values. These can be seen by highlighting the Process and in the Properties view clicking the Simulation tab.

    You must rename the simulation Parameters so they match the imported data you want to use.

    Note: Any simulation parameter that does not correspond to a parameter in the imported data follows the default Sequence Flow from a Gateway.

    Run the Simulation

  10. Run the simulation as normal. Note that the Start time in the Simulation Control view corresponds to the first value of the Time simulation that you imported and that the distribution of other parameters is taken from the imported data.As part of setting up a Process for simulation, you specify the duration of the Activities in the Process using a mathematical distribution (for example, Normal distribution). Alternatively, TIBCO Business Studio allows you to import any real historical data (for example, from log files) that you have about activity duration.
  11. Create an Excel spreadsheet with the data that you want to import. The first row of cells corresponds to the parameter names. Each column under the first row represents the parameter values you wish to import. For example:

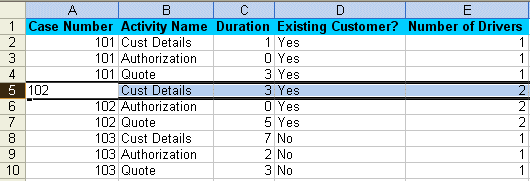
    In this example, the parameter Existing Customer? can have the values Yes or No.

    Note: Note the following requirements for the spreadsheet that you use for data import:
    • The spreadsheet must have columns for Activity Name and Duration (though not necessarily with those names).
    • You can include any number of other columns for import, but be careful to avoid stray data in columns that you do not plan to import.
    • Data from the first worksheet is imported; other worksheets are ignored.
  12. To import the spreadsheet containing your historical data, right-click the Process and select Import.
  13. Select Historical Case Data (Activity Duration).
  14. The names of the Project, Package and Process are displayed. Click Next.
  15. Either click Browse or Browse Workspace to locate the Excel file. Press the Tab key (this activates the Next button). Click Next.
  16. The Select Parameters dialog is displayed.
    • Select the parameter that represents the Activity Name.
    • Select the parameter that represents the Activity Duration.
    • In the Map Activity Names: section, map the Activities in the spreadsheet to those in the Process.

      Click Next.

  17. The next dialog allows you to map any parameters not already used in the previous dialog onto Activities in the Process. Click Next.
  18. For each Activity, there are three options for where the duration data is taken:
    • use the data specified in the process rather than the imported data - do not select the Activity.
    • use the imported data to create a normal distribution - select the Activity, but select IGNORED.
    • use the imported data, depending on a parameter setting - select the Activity and select the Parameter that will be used to determine which values to use.

      Clicking on each row gives the values, average duration and deviation from the average.

  19. Click Finish.
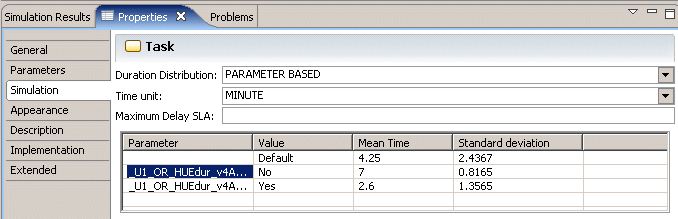
  20. The Simulation Properties view for Activities for which the duration is taken from the imported data show information about the parameter names and values. For example: