Data Flow of Monitoring Data and Log Messages
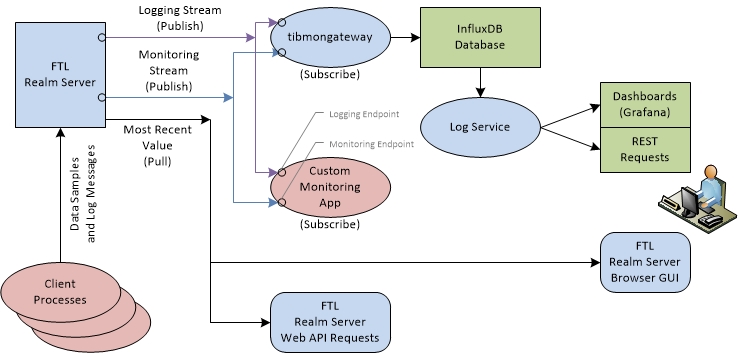
The following diagram illustrates the flow of FTL monitoring data and log messages.
Explanation of the Diagram
- All data begins in client processes. The TIBCO FTL client library monitors the metrics relevant to each client. It forwards monitoring data, log messages, and advisory messages to the TIBCO FTL realm server.
- When the realm server receives monitoring data from any of its clients, the realm server immediately publishes that data on the
monitoring stream.
When the realm server receives log messages or advisory messages from any of its clients, the realm server immediately publishes those messages on the logging stream.
Any FTL application can subscribe to the built-in monitoring endpoint to receive the monitoring stream, or the built-in logging endpoint to receive the logging stream.
- You can develop custom monitoring applications that subscribe to these streams and use their data.
- TIBCO FTL software includes an executable service application,
tibmongateway. It subscribes to both the monitoring stream and the logging stream, and stores their data in an InfluxDB database.
InfluxDB is an open-source database. You can access the data directly from InfluxDB, or using other tools that manipulate and display the data, for example, Grafana.
- The realm server retains only the most recent value of each metric from each client, and the most recent log from each client.
These values are available from the realm server through its web API and browser GUI.
Changes in Functionality
In Release 5.4 you can still use deprecated functionality related to Prometheus, which formerly was part of the Prometheus adapter.
Migrate your projects from Prometheus to InfluxDB.
Release 5.4 documentation no longer includes topics related to Prometheus. Refer to documentation from Release 5.3 if needed.