Grafana Dashboards
Grafana is an open source application to visualize large-scale measurement data. You can use Grafana to display monitoring data stored in a database.
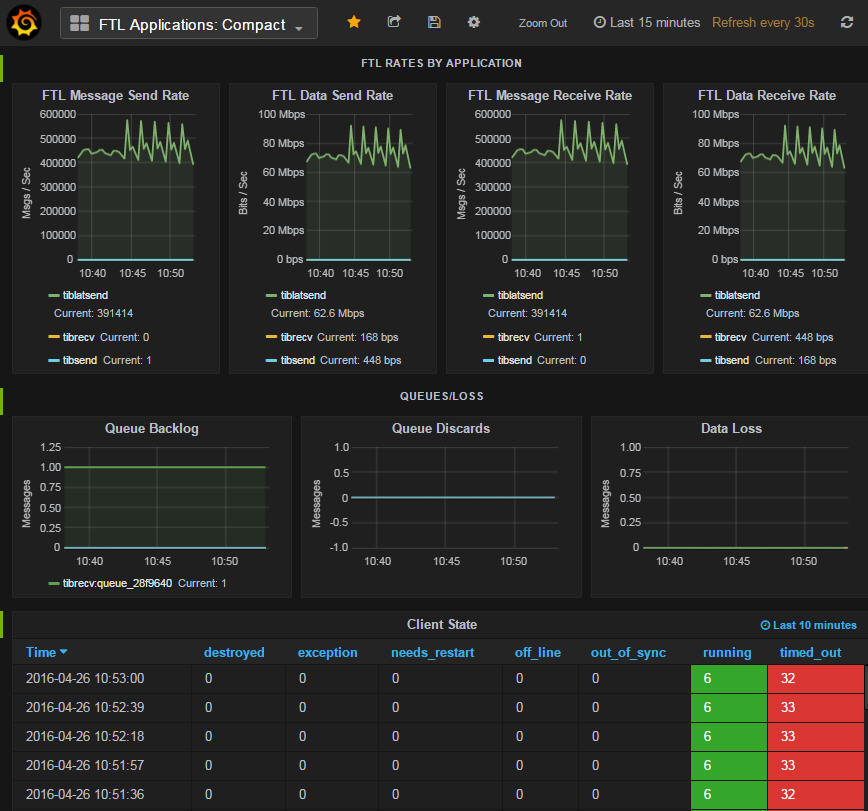
Grafana dashboards in the sample are tailored to display FTL monitoring data.
When the monitoring start script starts the Grafana server, it automatically loads the FTL dashboards from $FLT_HOME/monitoring.
You can also define your own dashboards.
Grafana and Docker
You can run Grafana processes in Docker containers. TIBCO FTL software can configure a Docker image for this purpose.
For convenience, you can start the Grafana server using a utility script, which also starts other monitoring components in the correct order. See Starting the Monitoring Components Starting the Monitoring Components.

