Outliers
Outliers are atypical (by definition), infrequent observations.
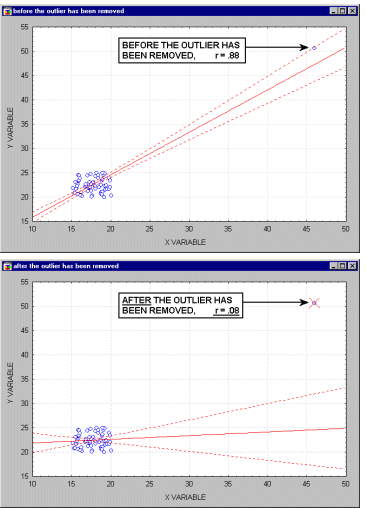
Because of the way in which the regression line is determined (especially the fact that it is based on minimizing not the sum of simple distances but the sum of squares of distances of data points from the line), outliers have a profound influence on the slope of the regression line, and consequently on the value of the correlation coefficient. A single outlier is capable of considerably changing the slope of the regression line and, consequently, the value of the correlation.
As shown on the illustration, just one outlier can be entirely responsible for a high value of the correlation that otherwise (without the outlier) would be close to zero. Needless to say, you should never base important conclusions on the value of the correlation coefficient alone, and examining the respective scatterplot is always recommended.
This is illustrated in the following example where we call the points being excluded outliers. They might not be outliers, however. They might be extreme values.
Typically, we believe that outliers represent a random error that we would like to be able to control.
Unfortunately, there is no widely accepted method to remove outliers automatically. Thus You must identify any outliers by examining a scatterplot of each important correlation.
The graphics options on the Advanced/Plot tab of the Product-Moment and Partial Correlations dialog and graphics editing facilities offer numerous ways to experiment with the interactive removal of outliers (brushing) to allow you to instantly see their influence on the regression line.
Needless to say, outliers may not only artificially increase the value of a correlation coefficient, but they can also decrease the value of a legitimate correlation.


