The Basic Idea Behind Structural Modeling
One of the fundamental ideas taught in intermediate applied statistics courses is the effect of additive and multiplicative transformations on a list of numbers. Students are taught that, if you multiply every number in a list by some constant K, you multiply the mean of the numbers by K. Similarly, you multiply the standard deviation by the absolute value of K.
For example, suppose you have the list of numbers 1,2,3. These numbers have a mean of 2 and a standard deviation of 1. Now, suppose you were to take these 3 numbers and multiply them by 4. Then the mean would become 8, and the standard deviation would become 4, the variance thus 16.
The point is, if you have a set of numbers X related to another set of numbers Y by the equation Y = 4X, then the variance of Y must be 16 times that of X, so you can test the hypothesis that Y and X are related by the equation Y = 4X indirectly by comparing the variances of the Y and X variables.
This idea generalizes, in various ways, to several variables inter-related by a group of linear equations. The rules become more complex, the calculations more difficult, but the basic message remains the same -- you can test whether variables are interrelated through a set of linear relationships by examining the variances and covariances of the variables.
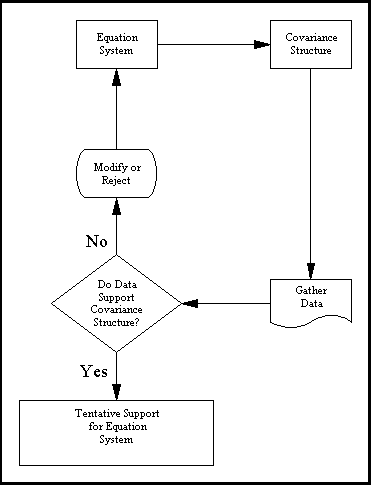
Statisticians have developed procedures for testing whether a set of variances and covariances in a covariance matrix fits a specified structure. The way structural modeling works is as follows:
- You state the way that you believe the variables are inter-related, often with the use of a path diagram.
- The program works out, via some complex internal rules, what the implications of this are for the variances and covariances of the variables.
- The program tests whether the variances and covariances fit this model of them.
- The program reports the results of the statistical testing, and also returns parameter estimates and standard errors for the numerical coefficients in the linear equations.
- On the basis of this information, you decide whether the model seems like a good fit to your data.
There are some important, and very basic logical points to remember about this process. First, although the mathematical machinery required to perform structural equations modeling is extremely complicated, the basic logic is embodied in the above 5 steps. Below, we diagram the process.

Second, we must remember that it is unreasonable to expect a structural model to fit perfectly for a number of reasons. A structural model with linear relations is only an approximation. The world is unlikely to be linear. Indeed, the true relations between variables are probably nonlinear. Moreover, many of the statistical assumptions are somewhat questionable as well. The real question is not so much, "Does the model fit perfectly?" but rather, "Does it fit well enough to be a useful approximation to reality, and a reasonable explanation of the trends in our data?"
Third, we must remember that simply because a model fits the data well does not mean that the model is necessarily correct. One cannot prove that a model is true to assert this is the fallacy of affirming the consequent. For example, we could say "If Joe is a cat, Joe has hair." However, "Joe has hair" does not imply Joe is a cat. Similarly, we can say that "If a certain causal model is true, it will fit the data." However, the model fitting the data does not necessarily imply the model is the correct one. There may be another model that fits the data equally well.
