Weibull and Reliability/Failure Time Analysis - The Weibull Distribution
A useful general distribution for describing failure time data is the Weibull distribution (see also Weibull CDF, reliability, and hazard functions). The distribution is named after the Swedish professor Waloddi Weibull, who demonstrated the appropriateness of this distribution for modeling a wide variety of different data sets (see also Hahn and Shapiro, 1967; for example, the Weibull distribution has been used to model the life times of electronic components, relays, ball bearings, or even some businesses).
Hazard function and the bathtub curve. It is often meaningful to consider the function that describes the probability of failure during a very small time increment (assuming that no failures have occurred prior to that time). This function is called the hazard function (or, sometimes, also the conditional failure, intensity, or force of mortality function), and is generally defined as:
h(t) = f(t)/(1-F(t))
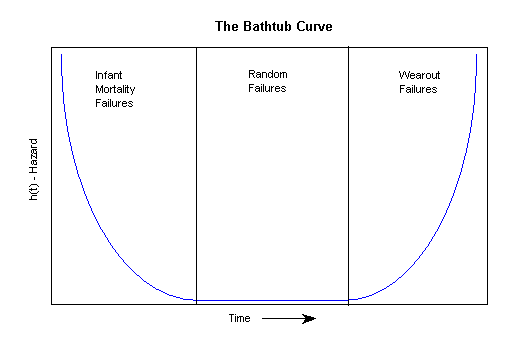
where h(t) stands for the hazard function (of time t), and f(t) and F(t) are the probability density and cumulative distribution functions, respectively. The hazard (conditional failure) function for most machines (components, devices) can best be described in terms of the "bathtub" curve: Very early during the life of a machine, the rate of failure is relatively high (so-called Infant Mortality Failures); after all components settle, and the electronic parts are burned in, the failure rate is relatively constant and low. Then, after some time of operation, the failure rate again begins to increase (so-called Wear-out Failures), until all components or devices will have failed.
For example, new automobiles often suffer several small failures right after they were purchased. Once these have been "ironed out," a (hopefully) long relatively trouble-free period of operation will follow. Then, as the car reaches a particular age, it becomes more prone to breakdowns, until finally, after 20 years and 250000 miles, practically all cars will have failed. A typical bathtub hazard function is shown below:
The Weibull distribution is flexible enough for modeling the key stages of this typical bathtub-shaped hazard function. Shown below are the hazard functions for shape parameters c=.5, c=1, c=2, and c=5.
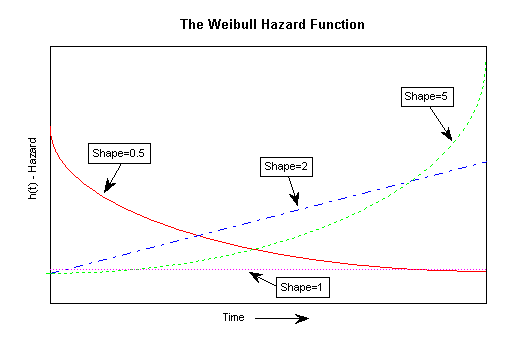
Clearly, the early ("infant mortality") "phase" of the bathtub can be approximated by a Weibull hazard function with shape parameter c<1; the constant hazard phase of the bathtub can be modeled with a shape parameter c=1, and the final ("wear-out") stage of the bathtub with c>1.
Cumulative distribution and reliability functions. Once a Weibull distribution (with a particular set of parameters) has been fit to the data, a number of additional important indices and measures can be estimated. For example, the Process Analysis module will compute the cumulative distribution function (commonly denoted as F(t)) for the fitted distribution, along with the standard errors for this function. Thus, you can determine the percentiles of the cumulative survival (and failure) distribution, and, for example, predict the time at which a predetermined percentage of components can be expected to have failed.
The reliability function (commonly denoted as R(t)) is the complement to the cumulative distribution function (i.e., R(t)=1-F(t)); the reliability function is also sometimes referred to as the survivorship or survival function (since it describes the probability of not failing or of surviving until a certain time t; e.g., see Lee, 1992). Shown below is the reliability function for the Weibull distribution, for different shape parameters.
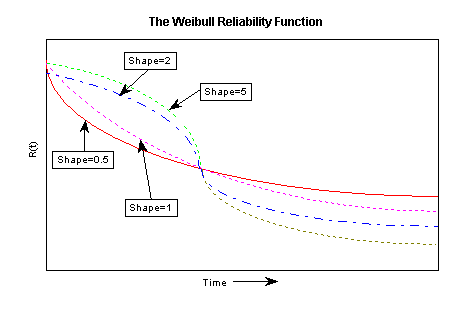
For shape parameters less than 1, the reliability decreases sharply very early in the respective product's life, and then slowly thereafter. For shape parameters greater than 1, the initial drop in reliability is small, and then the reliability drops relatively sharply at some point later in time. The point where all curves intersect is called the characteristic life: regardless of the shape parameter, 63.2 percent of the population will have failed at or before this point (i.e., R(t) = 1-0.632 = .368). This point in time is also equal to the respective scale parameter b of the two-parameter Weibull distribution (with = 0; otherwise it is equal to b+).
The formulas for the Weibull cumulative distribution, reliability, and hazard functions are shown in Weibull CDF, Reliability, and Hazard Functions.