Nonlinear Relations between Variables
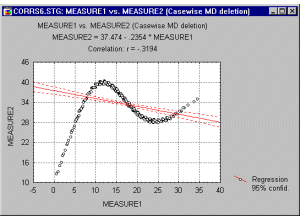
Another potential source of problems with the linear (Pearson r) correlation is the shape of the relation.
As mentioned before, Pearson r measures a relation between two variables only to the extent to which it is linear. Deviations from linearity will increase the total sum of squared distances from the regression line even if they represent a true and very close relationship between two variables. The possibility of such non-linear relationships is another reason why examining scatterplots is a necessary step in evaluating every correlation.
Copyright © 1995-2020 TIBCO Software Inc. All rights reserved.

