Exploratory Data Analysis (EDA) and Data Mining Techniques
Note. Exploratory Data Analysis (EDA) is closely related to the concept of Data Mining.
- EDA vs. Hypothesis Testing
- As opposed to traditional hypothesis testing designed to verify a priori hypotheses about relations between variables (There is a positive correlation between the AGE of a person and his/her RISK TAKING disposition), exploratory data analysis (EDA) is used to identify systematic relations between variables when there are no (or not complete) a priori expectations as to the nature of those relations. In a typical exploratory data.

- Computational EDA techniques
- Computational exploratory data analysis methods include both simple basic statistics and more advanced, designated multivariate exploratory techniques designed to identify patterns in multivariate data sets.
- Basic statistical exploratory methods
- The basic statistical exploratory methods include such techniques as examining distributions of variables (to identify highly skewed or non-normal, such as bi-modal patterns), reviewing large correlation matrices for coefficients that meet certain thresholds, or examining multi-way frequency tables (slice by slice systematically reviewing combinations of levels of control variables). The Statistica Data Miner Interactive Drill-Down Explorer also provides highly interactive options for computing various statistical and graphical summaries for selected variables based on interactively chosen groups and sub-groups only.

- Multivariate exploratory techniques
- Multivariate exploratory techniques designed specifically to identify patterns in multivariate (or univariate, such as sequences of measurements) data sets include: Cluster Analysis, Factor Analysis, Discriminant Function Analysis, Multidimensional Scaling, Log-linear Analysis, Canonical Correlation, Stepwise Linear and Nonlinear (Logit) Regression, Correspondence Analysis, Time Series Analysis, General Additive Models, Classification Trees, General Classification and Regression Trees, and General CHAID Models.
- Neural Networks
- Analytic techniques modeled after the (hypothesized) processes of learning in the cognitive system and the neurological functions of the brain and capable of predicting new observations (on specific variables) from other observations (on the same or other variables) after executing a process of so-called learning from existing data.
- Graphical (data visualization) EDA techniques
- A large selection of powerful exploratory data analytic techniques is also offered by graphical data visualization methods that can identify relations, trends, and biases hidden in unstructured data sets.
Brushing. Perhaps the most common and historically first widely used technique explicitly identified as graphical exploratory data analysis is brushing, an interactive method allowing you to select on-screen specific data points or subsets of data and identify their ( common) characteristics, or to examine their effects on relations between relevant variables. Those relations between variables can be visualized by fitted functions (e.g., 2D lines or 3D surfaces) and their confidence intervals, thus, for example, one can examine changes in those functions by interactively (temporarily) removing or adding specific subsets of data.
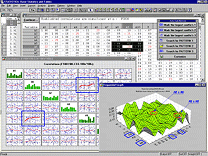
For example, one of many applications of the brushing technique is to select (highlight) in a matrix scatterplot all data points that belong to a certain category ( a medium income level. In order to examine how those specific observations contribute to relations between other variables in the same data set ( the correlation between the debt and assets in the current example). When using animated brushing in Statistica, you can define a dynamic brush that will move over the consecutive ranges of a criterion variable income measured on a continuous scale or a discrete (3-level) scale as on the illustration above] and examine the dynamics of the contribution of the criterion variable to the relations between other relevant variables in the same data set. Statistica offers a particularly comprehensive implementation of brushing techniques, interactive animated brushing, analytic brushing by selecting attributes of specific data points, and others.
- Other graphical EDA techniques
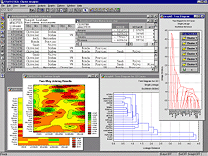
- Other graphical exploratory analytic techniques include function fitting and plotting, data smoothing, overlaying and merging of multiple displays, categorizing data, splitting/merging subsets of data in graphs, aggregating data in graphs, identifying and marking subsets of data that meet specific conditions, shading, plotting confidence intervals and confidence areas (ellipses), generating tessellations, spectral planes, integrated layered compressions (see example at left), and projected contours, data image reduction techniques, interactive (and continuous) rotation with animated stratification (cross-sections) of 3D displays, and selective highlighting of specific series and blocks of data.
- Verification of results of EDA
- The exploration of data can only serve as the first stage of data analysis and its results can be treated as tentative at best as long as they are not confirmed, (cross-validated, using a different data set [or an independent subset]). If the result of the exploratory stage suggests a particular model, then its validity can be verified by applying it to a new data set and testing its fit (testing its predictive validity). Case selection conditions can be used to quickly define subsets of data (for estimation and verification), and for testing the robustness of results.
