Association Rules - Graphical Representation of Associations
As a result of applying Association Rules data mining techniques to large data sets, rules of the form if "Body" then "Head" will be derived, where Body and Head stand for simple codes or text values (items), or the conjunction of codes and text values (items; e.g., if (Car=Porsche and Age<20) then (Risk=High and Insurance=High)).See also Computational Procedures and Terminology for additional details. These rules can be reviewed in textual format or tables (see Tabular Representation of Associations), or in graphical format (see below).
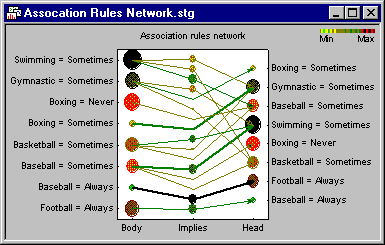
In this graph, the support values for the Body and Head portions of each association rule are indicated by the sizes and colors of each circle (see also Computational Procedures and Terminology). The thickness of each line indicates the confidence value (conditional probability of Head given Body) for the respective association rule; the sizes and colors of the circles in the center, above the Implies label, indicate the joint support (for the co-occurrences) of the respective Body and Head components of the respective association rules. Hence, in this graphical summary, the strongest support value was found for Swimming=Sometimes, which was associated Gymnastic=Sometimes, Baseball = Sometimes, and Basketball=Sometimes. Incidentally, you may want to compare these association rules with the results in the Examples in Basic Statistics: Unlike simple frequency and crosstabulation tables, the absolute frequencies with which individual codes or text values (items) occur in the data are often not reflected in the association rules; instead, only those codes or text values (items) are retained that show sufficient values for support, confidence, and correlation, i.e., that co-occur with other codes or text values (items) with sufficient relative (co-)frequency. See also Interpreting and Comparing Results.
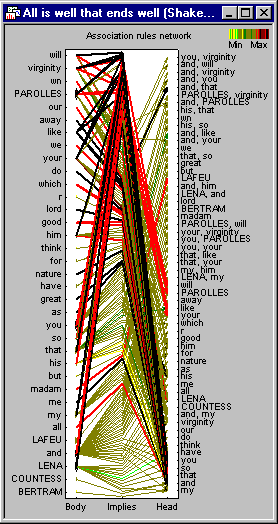
The results that can be summarized in 2D Association Rules networks can be relatively simple, or complex, as illustrated in the network shown below.
This is an example of how association rules can be applied to text mining tasks. This analysis was performed on the paragraphs (dialog spoken by the characters in the play) in the first scene of Shakespeare's All's Well That Ends Well, after removing a few very frequent words like is, of, etc. Of course, the specific words and phrases removed during the data preparation phase of text (or data) mining projects will depend on the purpose of the research.
- Association Rules Networks, 3D
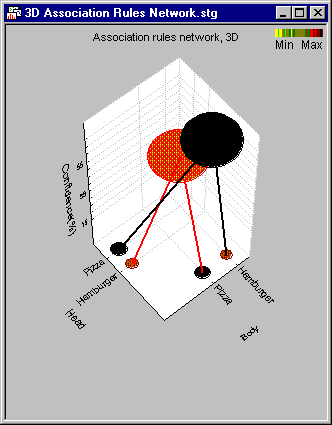
- Association rules can be graphically summarized in 2D Association Networks, as well as 3D Association Networks. Shown below are some (very clear) results from an analysis of the data in the example file Fastfood.sta, which is also discussed in the context of Multiple Response tables, in Basic Statistics (Example 6: Tabulating Multiple Responses and Dichotomies). Respondents in a survey were asked to list their (up to) 3 favorite fast-foods. The association rules derived from those data are summarized in a 3D Association Network display.
As in the 2D Association Network, the support values for the Body and Head portions of each association rule are indicated by the sizes and colors of each circle in the 2D plane (see also Computational Procedures and Terminology). The thickness of each line indicates the confidence value (joint probability) for the respective association rule; the sizes and colors of the "floating" circles plotted against the (vertical) z-axis indicate the joint support (for the co-occurrences) of the respective Body and Head components of the association rules. The plot position of each circle along the vertical z - axis indicates the respective confidence value. Hence, this particular graphical summary clearly shows two simple rules: Respondents who name Pizza as a preferred fast food also mention Hamburger, and vice versa.


