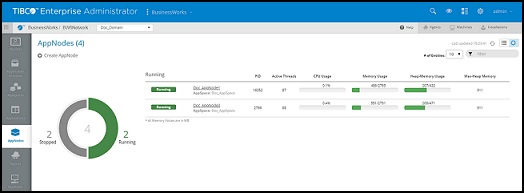
Viewing AppNode Statuses
An AppNode has two states: Deployment and Runtime.
The Deployment state can have the following statuses:
An AppNode's Runtime state relies on the timestamp of the hosting machine and on the timestamp of the machine hosting the bwagent. The timestamps on the machines must be within 20 seconds of each other for the status of the AppNode to be reported correctly. The Runtime state can have the following statuses:
Admin UI
To view heap memory usage, click on the graph view.
Following fields are available:
| Field | Description |
|---|---|
| PID | Process ID |
| Active Threads | Number of threads currently active on the AppNode |
| CPU Usage | CPU usage percentage |
| Memory Usage (MB) | Memory used versus allocated memory for a process as an AppNode in MB |
| Heap-Memory Usage | Shows used memory out of total memory. |
| MaxHeapMemory | Maximum heap memory that can be allocated to a JVM in bytes |
Copyright © 2020. TIBCO Software Inc. All Rights Reserved.


