Search Results
After running a search query, you can view search results in the Result tab.
You can visualize results using Charts or Data panel. After running a query, if you retrieve lots of results, you can group the results without having to issue a new query, and then drill-down into the information. You can see both aggregated counts as well as create visualization elements to better isolate trends and issues. You can include multiple filters to narrow your results. Create a filter in the context of an event, and view results based on a specific filter.
After running the search query, a progress bar is displayed above the Result tab showing the progress of the query. Based on your data, it might take a few minutes to retrieve results into all three panels. By default, results are returned in ascending order.
Querying a large data set using Advanced Search might display an error or an exception if the result contains more than a few million records.
Click
![]() to add multiple result tabs to view the same data in different forms. When results are grouped together, a new
Result tab is displayed showing the grouped results for the selected value.
to add multiple result tabs to view the same data in different forms. When results are grouped together, a new
Result tab is displayed showing the grouped results for the selected value.
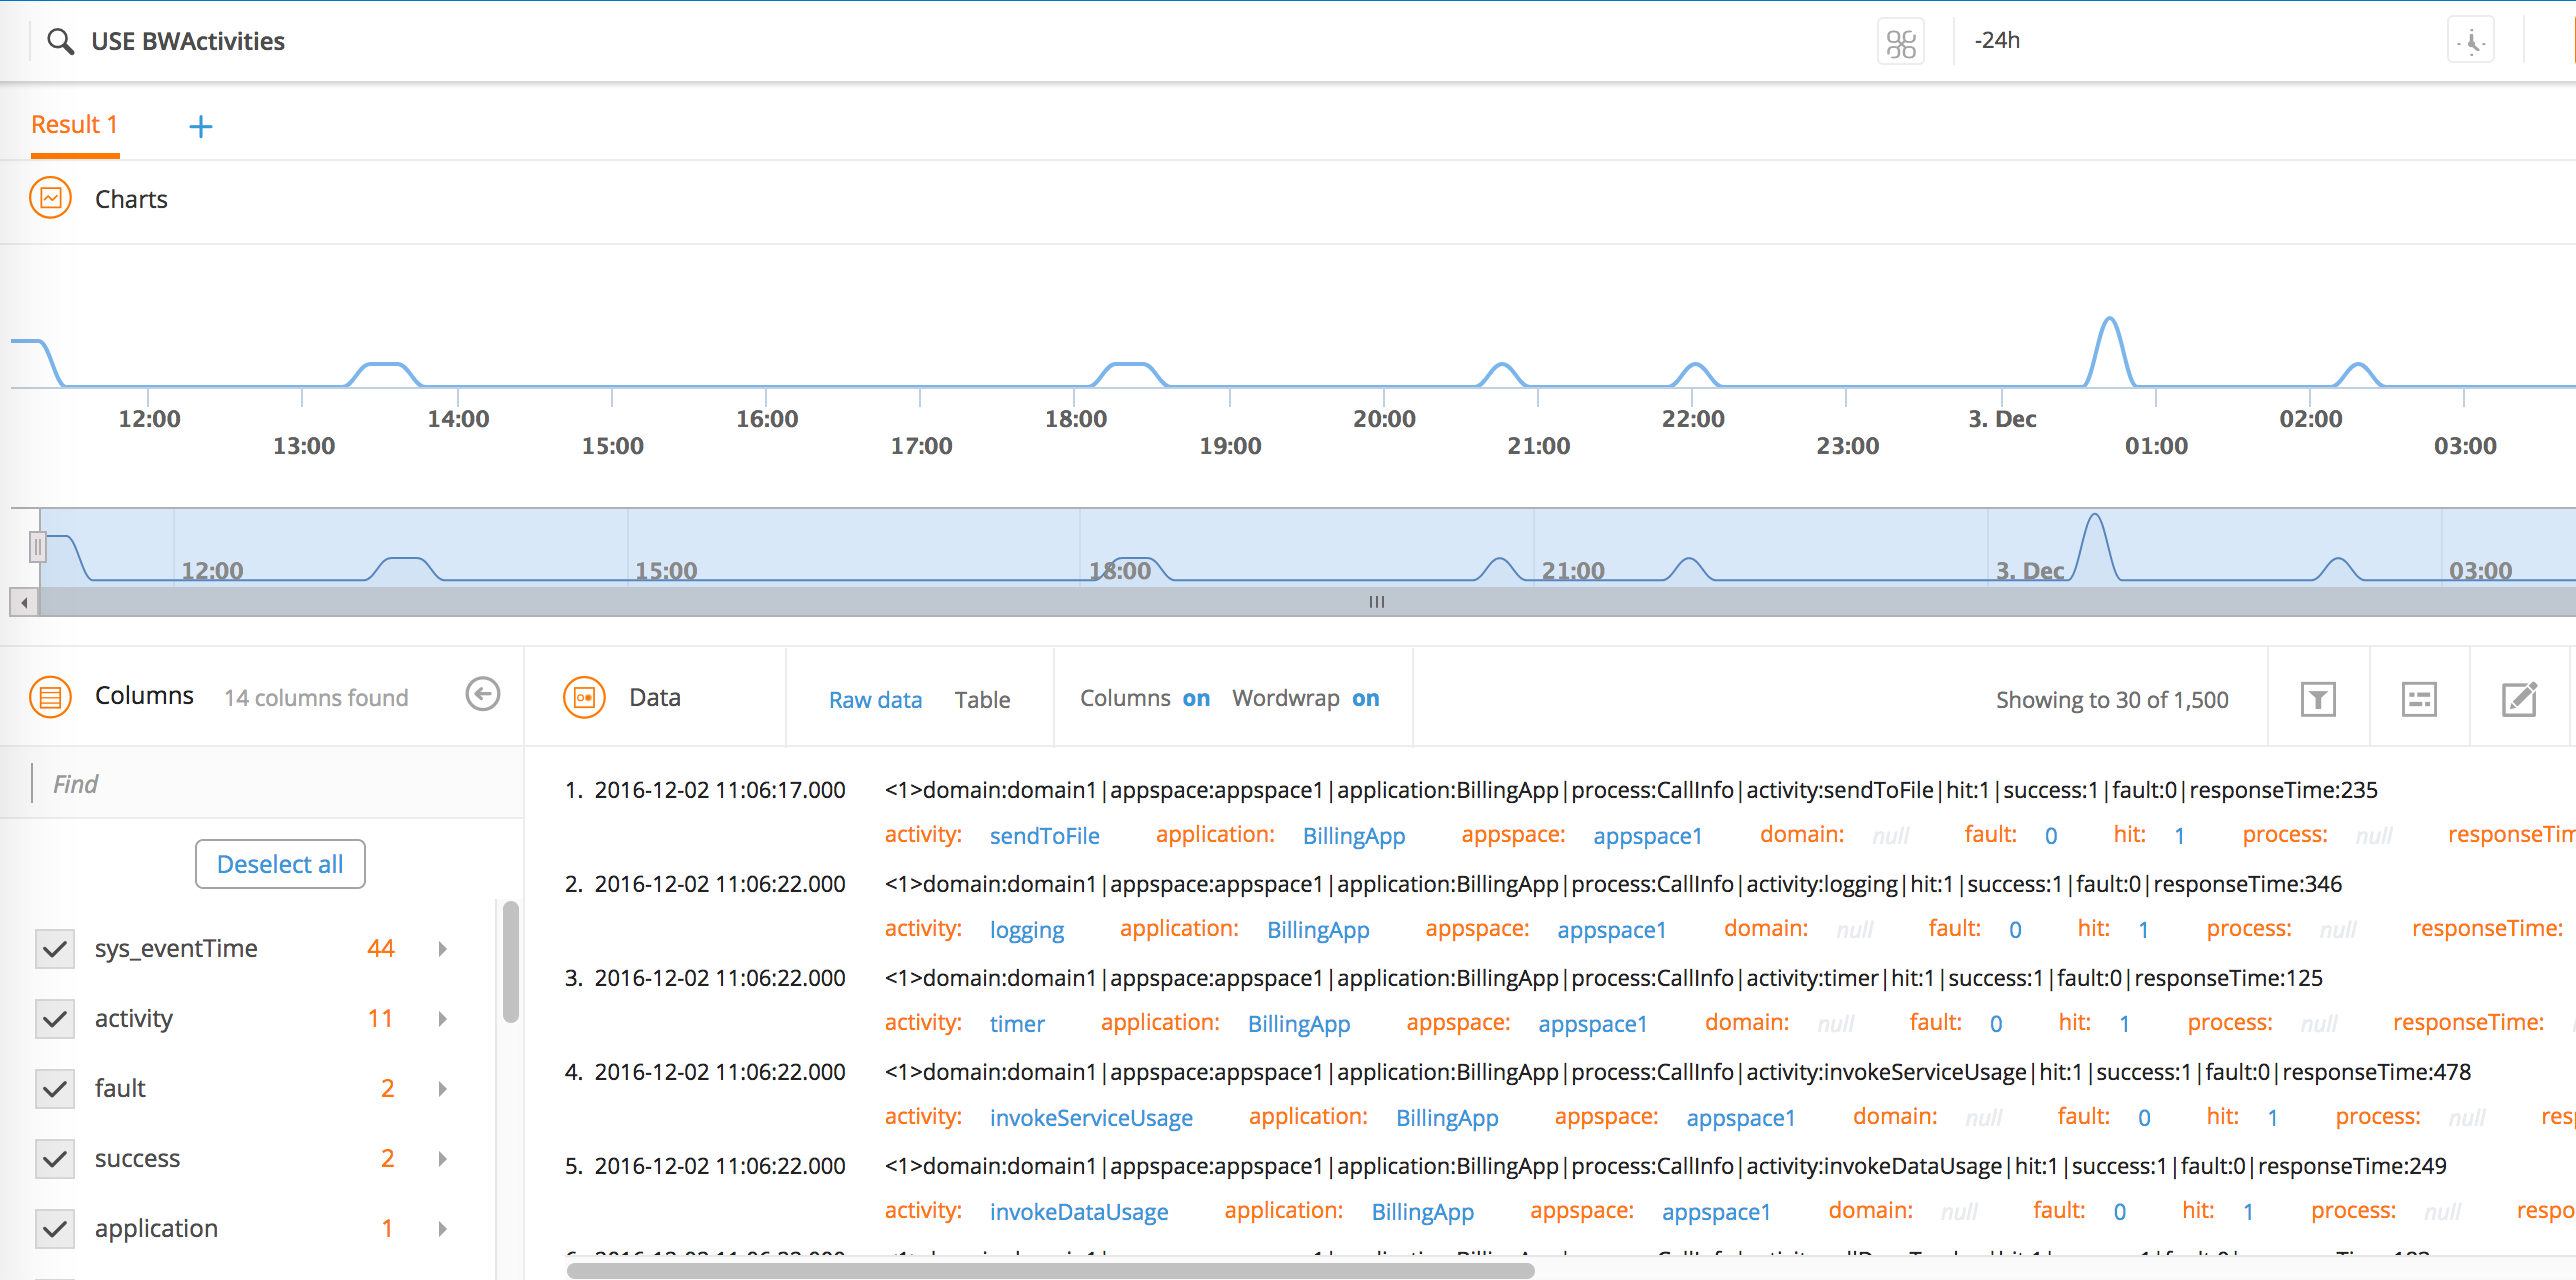
The Result tab is divided into three panels:
- Charts display the distribution of events in time using a line chart in the top panel.
- Columns provide all available columns and their associated values based on each search query in the left bottom panel.
- Data display data in different formats in the right bottom panel: raw format and normalized tabular format.