Columns
Based on your search query, all available columns are displayed in the Columns panel.
You can group together your results based on any column and the value associated with that column. Similarly, filtering helps you fine-tune your search results when analyzing big data.
System columns are columns with event metadata that are present in all data models by default. For a list of system columns, see Columns. Additional columns are available depending on the data models involved in the query.
From the Columns panel, you can perform the following tasks:
- Showing or hiding Columns panel
Click
 located on the right corner to hide the
Columns panel. Click
located on the right corner to hide the
Columns panel. Click
 to show the
Columns panel.
to show the
Columns panel.
- Finding columns
You can quickly find the desired column by typing the column name in the Find field. As you start typing a column name in the Find field, all possible columns that start with the letters that are typed get displayed in the pane. The Columns panel is refreshed based on the selection.
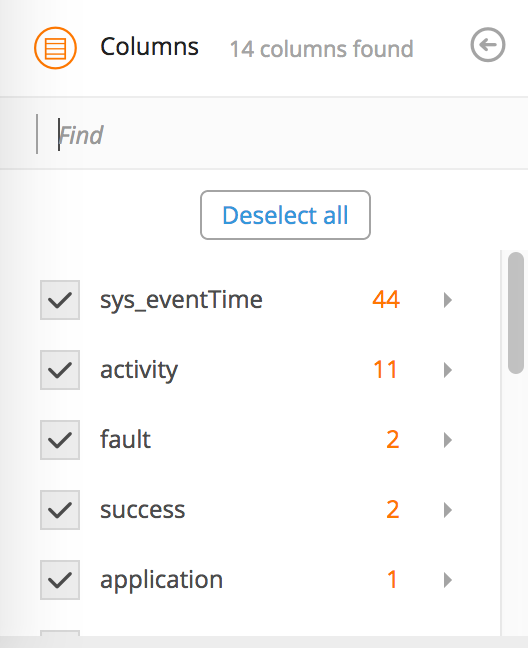
- Showing or hiding columns from the Data panel
Select the check box to show the column in the Data panel. Clear the check box to hide the column from the Data panel. Click Select all to select all columns. Click Deselect all to hide all columns.
The
 located on the left side of the column name defines that the column is displayed in the
Data panel. The
Data panel gets updated immediately based on your selection.
located on the left side of the column name defines that the column is displayed in the
Data panel. The
Data panel gets updated immediately based on your selection.
- Viewing column value details
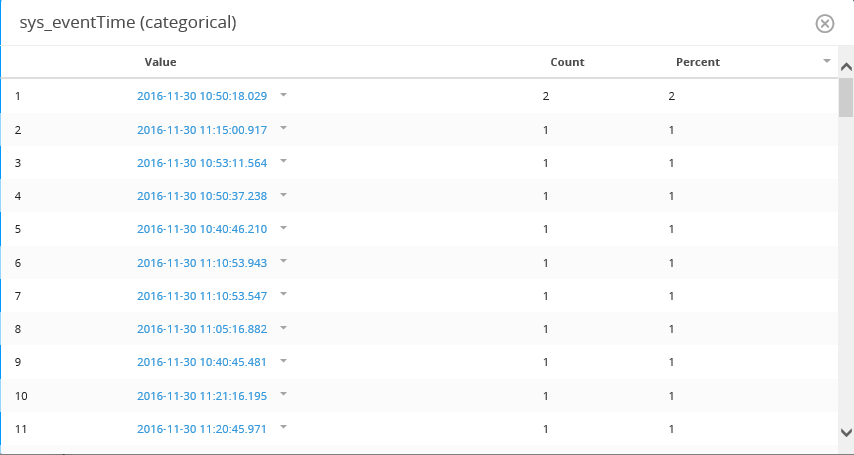
Click the column value and then select Show values to view the details of the selected value. The window displays a maximum of 100 distinct values for the selected column. The Percent column is calculated using the maximum 100 distinct values. When the distinct values for a column exceed 100, the Percent column is not displayed. If you filter on a particular column value, then the percent value on the top shows the percentage of occurrence of this particular column value in the entire result set.
The following illustration displays values for the column sys_eventTime.
- Filtering results based on the column value
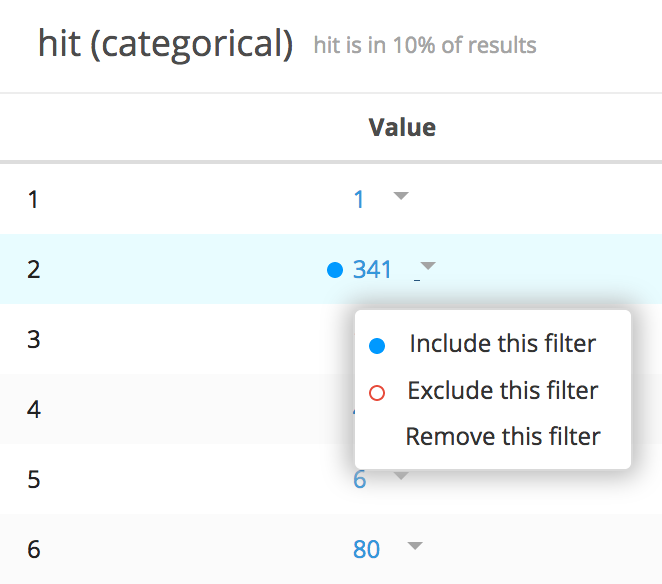
Click the Value link and select Include this filter to filter results based on that value. If you select the Exclude this filter option, the results are displayed without the defined value. You can add multiple filters. Select Remove this filter to remove the selected filter from the results. The blue icon
 represents included values and red icon
 represents excluded values from filtering data on the
Data panel.
represents excluded values from filtering data on the
Data panel.
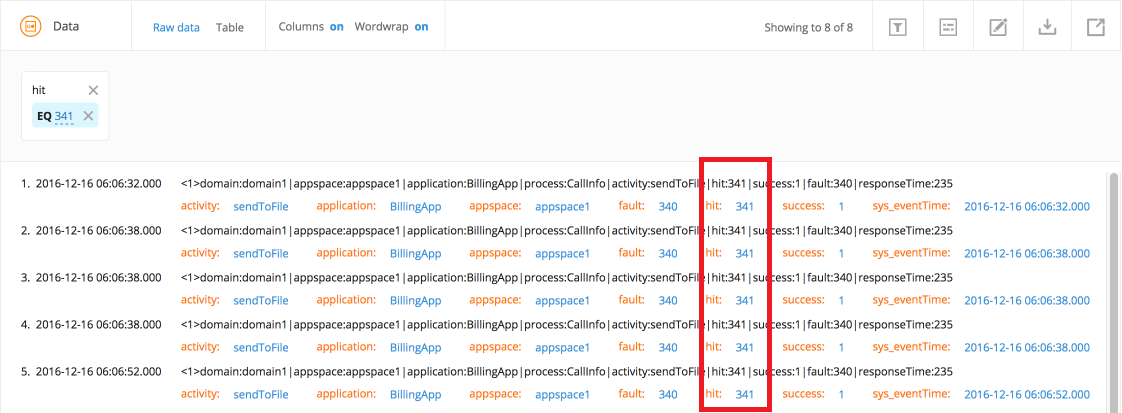
The following illustration displays filtered results based on the value filter 341 included for a numeric column hit.
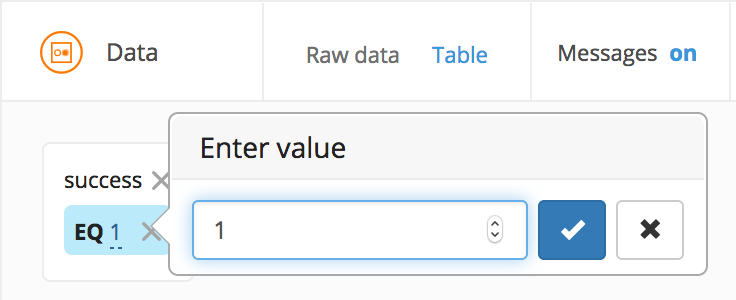
- Editing value filters to refine results
Based on your selection, a new filter is added in the Data panel and the refined results are displayed based on the filter. Click inside the value filter box to edit the value. Click the check mark to update the value changes. The Data panel results are refreshed based on the updated filters.
- Grouping by values
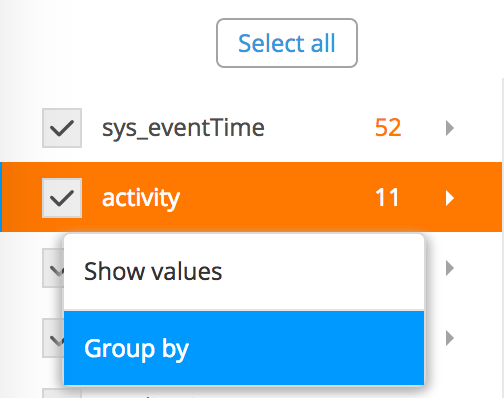
Click the column value and then select Group by to view grouped results. A new Result tab opens showing the results that are grouped by the column.
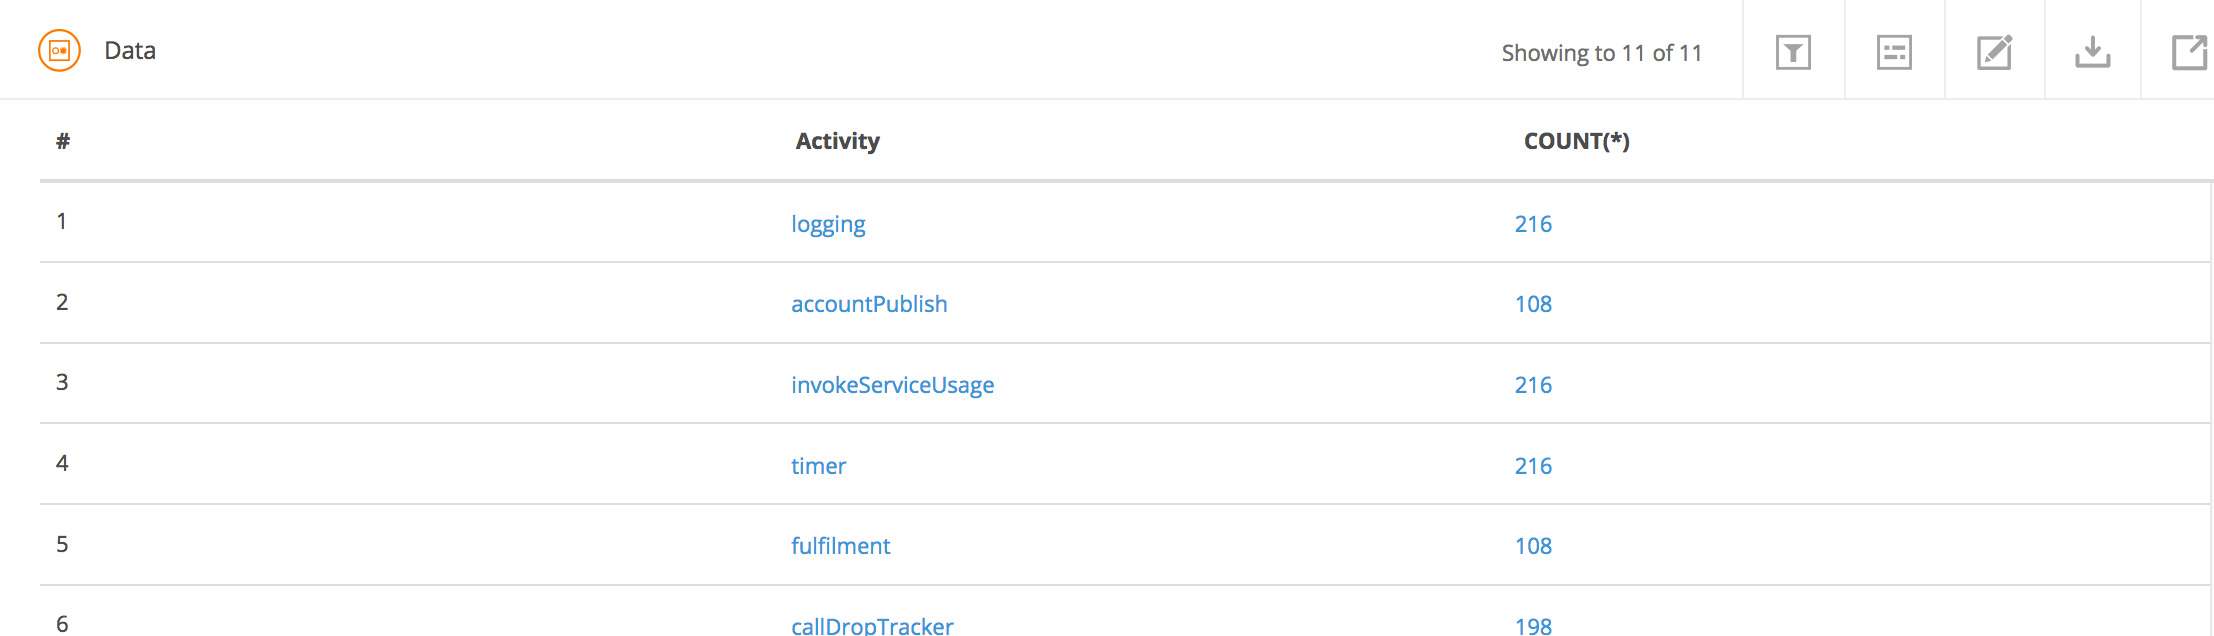
The following illustration displays the results grouped by the activity column.
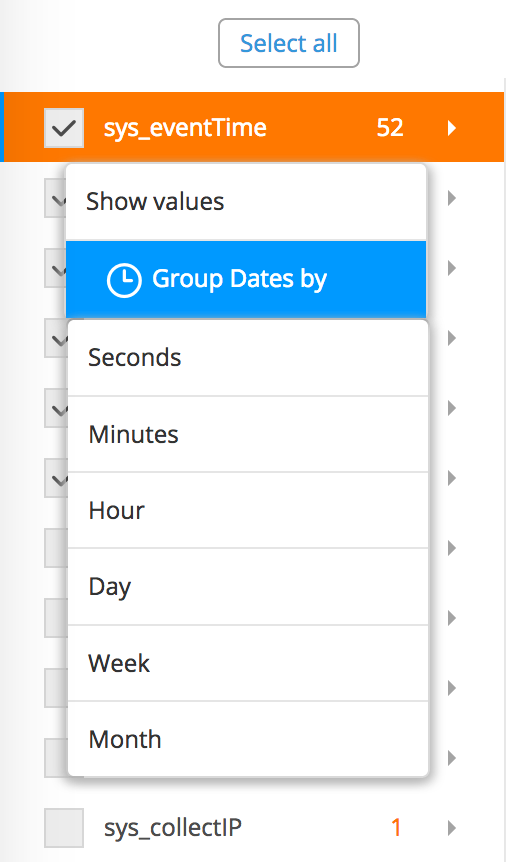
You can group by different time ranges. Click the timestamp value, and select the Group Dates by option. From the list, select the option to group your results by different time periods. A new Result tab opens showing the results that are grouped by different time units.
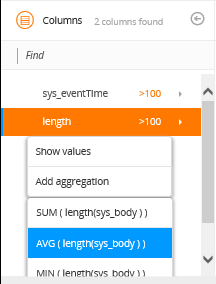
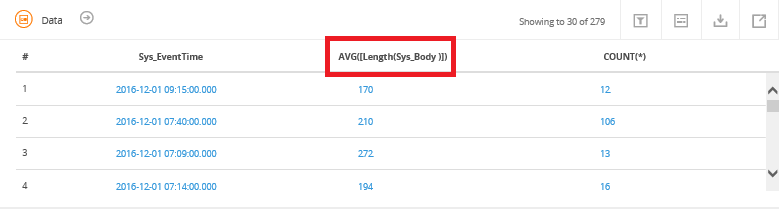
You can aggregate columns that have Integers and Long values. Click the column value and select Add aggregation. Define how to group values in the aggregation column. The options are: SUM, MIN, MAX, AVG. A new column is added in the Data panel.
Note: The aggregation menu is only available after a GROUP BY operation, and only for numeric columns. However, if a GROUP BY operation is already used in the query, the results cannot be aggregated further.The following illustration displays a new aggregation column (AVG) added in the Data panel.