Dependency View
The Dependency View is a statistical tool, used in project management, that is designed to analyze and represent the plan-items involved in completing a given plan.
The major difference between the Dependency View and GANTT chart is that GANTT charts emphasize the time it takes to complete tasks (plan-items), while the Dependency view charts emphasize relationships between tasks (plan items).
The Dependency View chart has the following components:
Activity nodes
Each of the activity nodes corresponds to a section. A section is modeled in the plan-fragment model and it consists of a start and an end milestone. In case intermediate milestones are present in the plan, multiple sections can be in the plan-item. The Dependency view shows all the sections that are present in each plan-item.
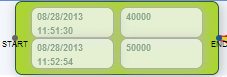
The Activity node consists of the following information:
- Start time for a particular section. If the section is still in PENDING state then the start time will be empty.
- End time for a particular section. If the section is still in PENDING/EXECUTION state then the end time will be empty.
- Typical duration defined in the plan-fragment model for a particular section. Typical duration is modeled in milliseconds unit.
- Maximum duration value defined in the plan-fragment model for a particular section. Maximum duration is modeled in milliseconds unit.
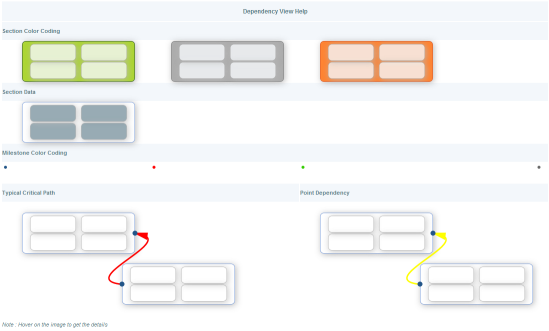
- Each section can have one of the following states: PENDING/EXECUTION/COMPLETE. Different color coding will be used to represent different states of the section.
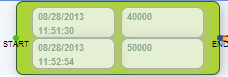
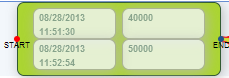
An Acivity node is illustrated below:

Completed states are in green, pending states are gray, and executed states are orange. The Activity node is illustrated below:
Dependency Types
Two types of dependencies are displayed in the Dependency View: Point Dependencies and Time Dependencies.
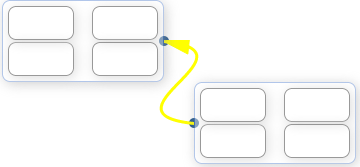
A Point Dependency, illustrated below, is displayed with yellow connecting arrows that indicate a ‘dependent-on’ kind of relationship.
The typical critical path is displayed with red connecting arrows. This path, calculated by the Jeopardy Management System, is the longest duration path that can calculated in the plan. For more information, see the Jeopardy Management System chapter. The typical critical path is illustrated below:

When there is a point dependency on the typical critical path, the red and yellow arrows will overlap, as illustrated below:

The Time Dependency is shown at the start milestone level with color notation, illusrated below:

- If a Time Dependency has a START milestone state of PENDING and the time dependency defined on the milestone is not yet met, the START milestone will be shown with a GREY color dot, illustrated below:
- If a Time Dependency has a START milestone state of COMPLETE and the milestone was completed on or within the time frame of the assigned time dependency, the START milestone will be shown with a GREEN color dot, illustrated below:
- If a Time Dependency has a the START milestone state of COMPLETE or PENDING and the milestone has missed the defined time dependency, the milestone will be shown with a RED color dot, illustrated below:
Viewing Plan/Plan-Item/Milestone Details
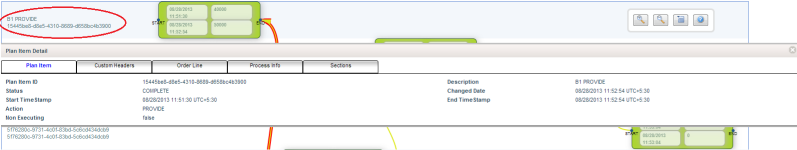
Each row in the details screen represents a single plan-item. The plan-item’s description and plan-item id is used for representing an individual plan-item. Clicking a plan-item description and a plan-item id combination will display theplan-item details, illustrated below:
Clicking the milestone-id will display the milestone details, as shown below:.

Toolbar
The toolbar has zoom, plan detail, and help options:

When you hover over the toolbar, you can drag the toolbar anywhere in the frame.
Click the Plan Details icon to display plan details:

Click the Help icon to open the Help window with details on the notations used in the Dependency View. Hover on the images shown in the help to diisplay more information.