Logistic Regression Use Case (1)
Binomial logistic regression is used extensively in the medical and social sciences fields, and in marketing applications that predict a customer's propensity to purchase a product.
Credit Delinquency
The following model demonstrates using a logistic regression model to assess chances of credit delinquency. In this case, the Value to Predict might be defined as the probability of a "1" for an individual having a seriously delinquent credit card balance. A logistic regression could predict the chances of a Serious Delinquency value of 1 given the individual's revolving utilization, debt ratio, credit lines, monthly income, age, education, number of dependents, and number of times 30/90 days late.
Datasets
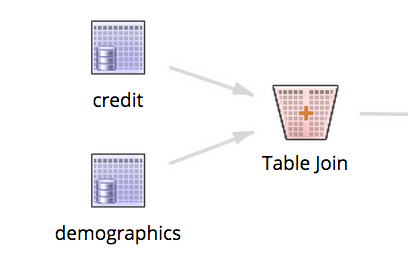
This example dataset was created by joining two source datasets: one with credit history (credit.csv (1.8MB)), and one with demographic profile data for each client (demographics.csv (1.4MB)).
The Table Join operator configuration and the resulting dataset are shown below.
Workflow
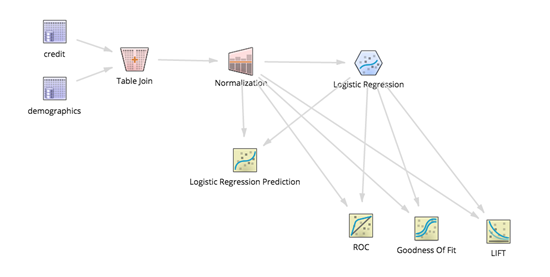
Build a logistic regression model from the joined dataset by adding the Logistic Regression and Logistic Regression Prediction operators, as well as the ROC (Receiver Operating Characteristic), Confusion Matrix, Goodness of Fit, and LIFT scoring operators, as follows.
Results
The Summary section displays the following.

Always check the ratio of the Chi-Squared value to Null Deviance. This ratio is the portion of the Dependent Variable's variance explained by the logistic regression model: an analogue of R2 statistic for linear regression. In this example, the percent of variance explained is 4163.5420/18528.9167, or 22.4%. (Not very high.)
The Data results section displays the following:
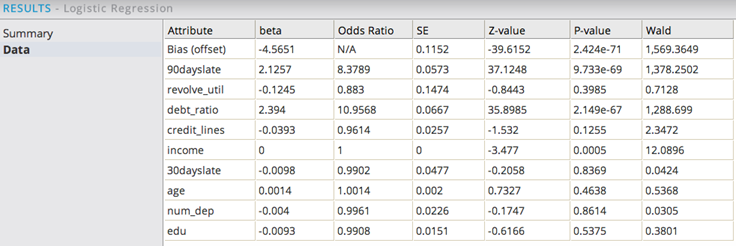
For analysis, sort by P-value by clicking the column header. This provides a quick way to assess the confidence of the variable being significant in the model. The smaller the P-value the better.
In this example, 90dayslate, debt_ratio, and income all have P-values less than 5%. You can iterate on the model, removing the less significant parameters such as credit_lines, revolve_util, age, edu, 30dayslate, and num_dep. Rerun the model and recheck the significance.
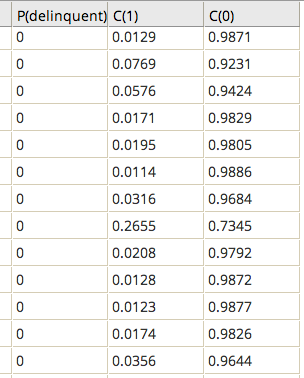
Including the Logistic Regression Prediction operator provides additional model results:
- The prediction value (0 or 1) uses a threshold assumption of less than 50% confidence that the prediction happens.
- The C(1) column indicates the confidence that the Dependent value is 1.
- The C(0) column indicates the confidence that the Dependent value is 0.
- The modeler can decide to ignore the prediction column and use a different confidence level to group the individuals likely to have credit delinquency, using a lower threshold such as 0.25, for example.
Hooking in additional logistic regression model diagnostic tools, such as the ROC graph, LIFT, and Goodness Of Fit operators, provides additional feedback on the quality of the model.
The ROC Curve plots the sensitivity (percent of correctly-classified results) versus false positives, as shown below.
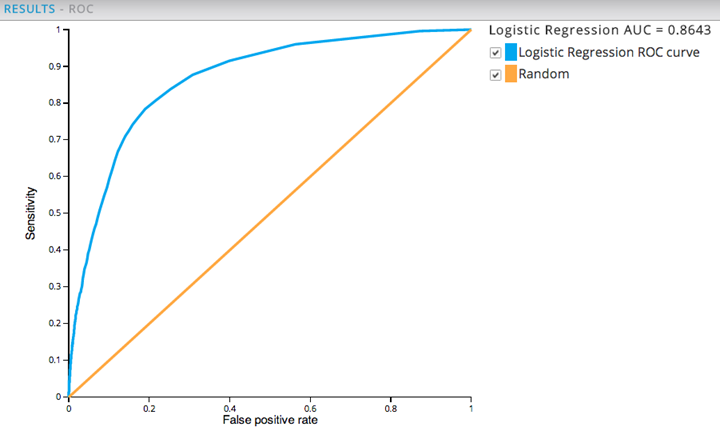
The larger the AUC value, the more predictive the model is. Any AUC value over .80 is typically considered a "good" model. A value of .5 just means the model is no better than a "dumb" model that can guess the right answer half of the time.