PCA (HD)
Uses an orthogonal transformation to convert a set of observations of possibly correlated variables into a set of values of uncorrelated variables (principal components).

Algorithm
PCA (Principal Component Analysis) is an orthogonal linear transformation that transforms data into a new coordinate system such that the greatest variance by any projection of the data comes to lie on the first coordinate (called the first principal component), the second greatest variance on the second coordinate, the third on the third coordinate, continuing until the number of coordinates has been reached or a preset maximum principal component threshold has been reached.
The Alpine PCA operator implements an eigenvalue decomposition of a data covariance matrix Σ (or, correlation matrix R).
- Each principal component is a linear combination of the original variables.
- The coefficients (loadings) are the eigenvectors (v1, v2,...vp) of covariance matrix Σ (or, correlation matrix R) with unit length.
- The eigenvalues (λ1, λ2,...λp) denote the contribution of the principal component associated with it.
- The principal components are sorted by descending order according to their variance contribution.
- The user can choose the number of principal components according to the accumulation contribution (∑ij=1λj/∑pK=1λK).
More details are available in Principal Component Analysis, (1986), Joliffe, I.T.
Additional references:
- Jerome Friedman, Trevor Hastie, Robert Tibshirani (2008), The Elements of Statistical Learning Data Mining, Inference and Prediction Chapter 3: "Linear Methods for Regression"
- Joliffe, I.T. (1986), Principal Component Analysis, New York, Springer
- Wu, W., Massart, D.L., and de Jong, S. (1997), "The Kernel PCA Algorithms for Wide Data. Part I: Theory and Algorithms" Chemometrics and Intelligent Laboratory Systems, 36, 165-172.
| Parameter | Description |
|---|---|
| Notes | Any notes or helpful information about this operator's parameter settings. When you enter content in the Notes field, a yellow asterisk is displayed on the operator. |
| Columns | Click Columns to open the dialog box for selecting the available variable columns to transform by the PCA algorithm, in order to create a reduced set of variables. |
| Center | If
Yes (the default), the mean value of each variable column is set to 0 before the PCA matrix transformation algorithm is run. In combination with
Scale, the following applies.
Usually, the PCA algorithm has meaning only if the data is centered first, so the default is set to Yes. When Use Spark is set to Yes, then this parameter is greyed out. |
| Scale | When the
Scale option is selected, each variable's data values are divided by the Standard Deviation so that all of the columns have the same data spread (that is, to be on an equivalent scale as each other).
See Center for more information about its effect on the algorithm. Default value: Yes. Note that variables with zero Standard Deviation should not be input into PCA. When Use Spark is set to Yes, then this parameter is greyed out. |
| In Memory Threshold | Determines whether to compute the PCA by a Hadoop MapReduce job or in memory SVD (single machine instead of distributed mode).
If the number of rows in the training data set is fewer than the threshold value, the PCA algorithm is run in memory SVD. Otherwise, it is computed by a MapReduce job. |
| Maximum Number of Components to output. | Determines the upper-limit number of principal components to calculate, starting with the top, high-ranking variance components. This value must be equal to or typically less than the number of columns in the training data set, to help with dimension reduction.
The choice of this value depends on the desired cumulative variance to cover. To check whether this number would return enough components, inspect the output tab Variance (when Use Spark is set to Yes) or the output tab Cumulative Variance (when Use Spark is set to No). |
| Additional Runs for Distributed Mode | Specifies the number of required extra passes of the algorithm to implement when computing in-memory SVD. Typically, a single pass result is sufficient when the number or rows are less than the In Memory Threshold value.
Default value: 0 (no additional runs). When Use Spark is set to Yes, then this parameter is greyed out. |
| Max JVM Heap Size (MB) (-1=Automatic) | A Java Virtual Machine data storage setting for Hadoop. (Spark option only.)
When Use Spark is set to Yes, then this parameter is greyed out. |
| Use Spark | If Yes (the default), uses Spark to optimize calculation time. |
| Advanced Spark Settings Automatic Optimization |
|
Output
- Visual Output
- The visual output for Hadoop provides visualizations of the principal components and their contribution weightings, scaling, centering, variance, and cumulative variance.
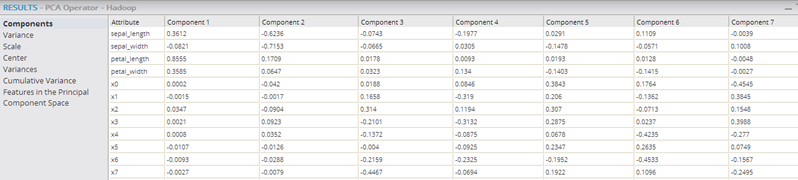
- Components
- Shows the new principal components as the columns and each row provides the source data variable's contribution to the derived component value.
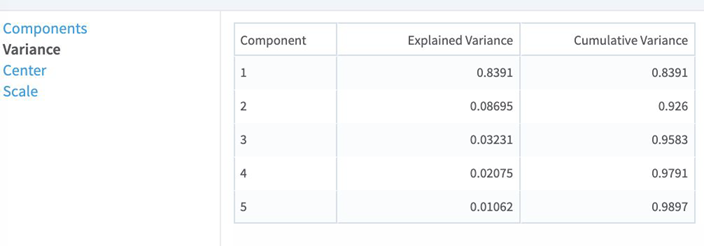
- Variance
- Shows each principal component's contribution to the overall data variance. Variance provides a measure of how much of all the variance in the original data set is captured by a given component. When
Use Spark is set to
Yes, this tab also contains the Cumulative Variance as an additional column. The
Variance column is called
Explained Variance.
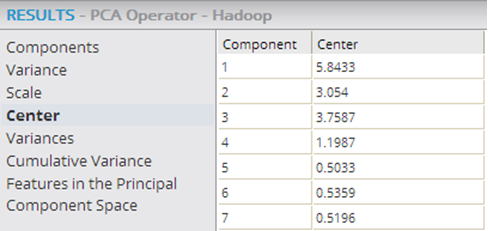
- Center
- Shows if any centering was done to the original data set column to clean up the data before computing the principal components. The data displayed shows the center value of the original data set's columns that were used in the PCA algorithm. Note: If the values are not 0, the data was not centered prior to running the algorithm. It is best to normalize the source data and center it around 0 before running the PCA algorithm.
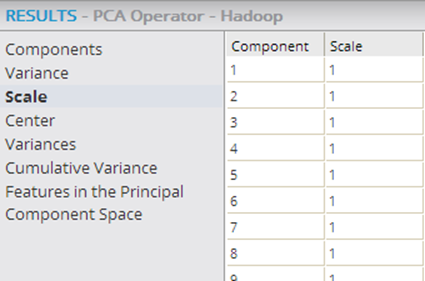
- Scale
- Shows the relative size of the source data set's columns relative to their original values passed in. Note: if the value is not "1" (meaning 100% of its original value), no scaling was done prior to running the PCA algorithm.
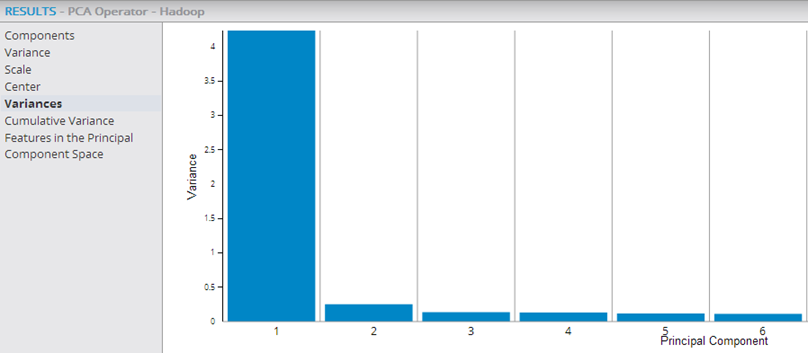
- Variances
- Shows each principal component's contribution to the overall data variance (for the Variance data provided above). Variance provides a measure of how much of all the variance in the original data set is captured by a given component. The visualization output is helpful to quickly see how many of the principal components explain most of the data set's variance. If the first few principal components have higher Variance values and then the values drop off, those are the components that should be used as the reduced dimension data set.
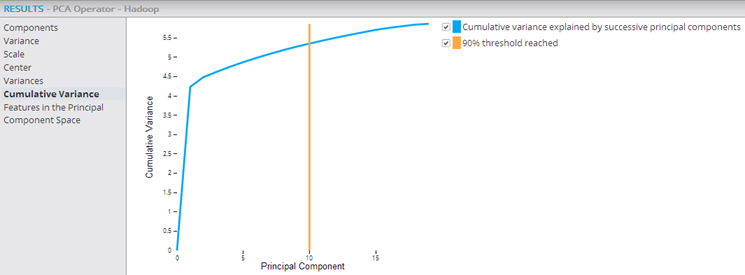
- Cumulative Variance
- This graph provides a visualization of the cumulative importance of each principal component (starting with the most significant principal component) and of how effectively the components explain the data set. The 90% Threshold Reached line shows the cumulative principal component point at which 90% of the data variance is explained. This helps know how many of the principal components explain the bulk of the data variance. In the example below, it is the first 10 principal components that explain 90% of the data variance.
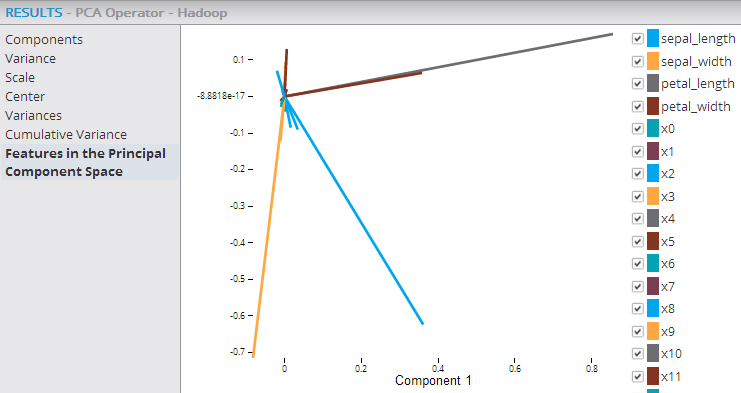
- Features in the Principal Component Space
- This graph provides a visualization of the source variables' (columns) axis from the original data space into the two-dimensional space spanned by the first and second principal components. As a result, those variables (columns) whose axes are near each other in the Principal component space have higher correlation to each other and the longer vectors (axes) have higher relevance in explaining the overall variance. In the example below, the three axes for sepal_width, sepal_length, and petal_length are the longest and most relevant to the datavariance. Also, the sepal_width and sepal_length variables are more closely correlated to each other than the sepal_length and petal_length are.
Note: To learn more about the visualization available in this operator, go to Explore Visual Results. - Data Output
- The PCA Operator for Hadoop outputs the principal components, not the transformed data set itself.
Note: To perform the transformation against a data set, the Hadoop PCA operator must be succeeded by a Predictor operator. This operator adds the transformed columns y_0_PCA,..., y_p_PCA, where (p+1) is the minimum between the number of selected columns and the value of the input parameter Maximum Number of Components to output . The transformation can then be processed against the source training data set or a new input data set (with the same variables).
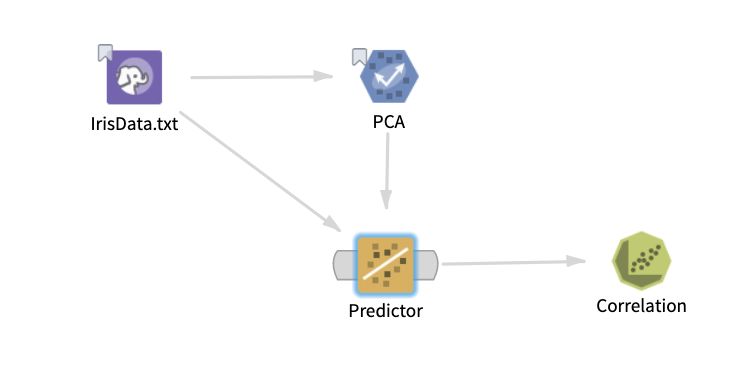
The following example shows the PCA and Predictor operators within a Hadoop workflow, with their output being passed into the Correlation operator, which confirms that the added transformed variables are uncorrelated.
See the Predictor operator for more details.