K-Means Use Case
The K-Means operator is useful in analyzing various dataset types, including biological datasets (such as human genetic clustering, genotype assigning, sequence analysis, organism community analysis), medical data sets (such as tissue and blood clustering, IMRT segmentation), business and marketing data sets (such as market research clustering of the population of consumers, shopping cart item grouping, social network analysis), and social science data sets (such as crime analysis of hot spots of a similar crime and student/school clustering).
The following model demonstrates using a k-means cluster analysis model to get an overall understanding of the various naturally occurring telecommunication clusters of cell phone usage.
This use case exemplifies how cluster analysis can be applied to market research for partitioning a population of users or consumers into market groupings. This can be useful, for example, for market segmentation, product positioning, and targeting marketing campaigns.
- Datasets
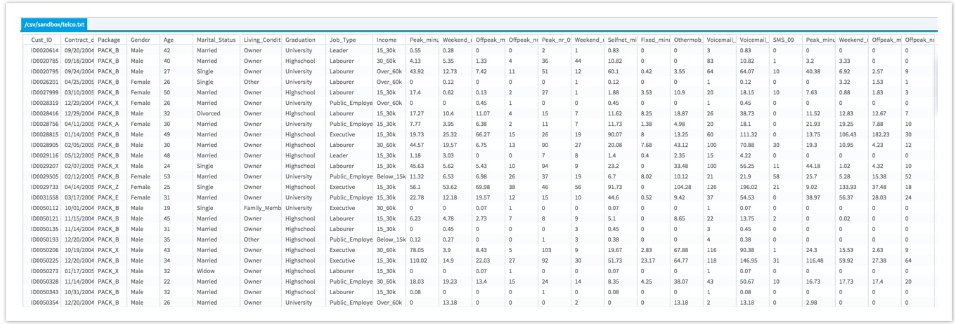
- This dataset tracks various usage metrics for each customer (Weekend_minutes,
Offpeak_minutes,
Peak_minutes) along with some customer demographic information.
The dataset used for this case is telco.csv (4MB). It contains 59 columns and 15654 observations, the first few rows and columns are shown below:
Workflow
The setup of this Analytic Flow is simply the data source followed by the K-Means operator.

The K-Means Operator configuration properties can be kept at their default values. The ID column should be set to the Cust_ID field.
As a quick assessment, the modeler might select three cell phone usage metrics of weekend_minutes, peak_minutes, and offpeak_minutes for a quick K-Means analysis.
Results
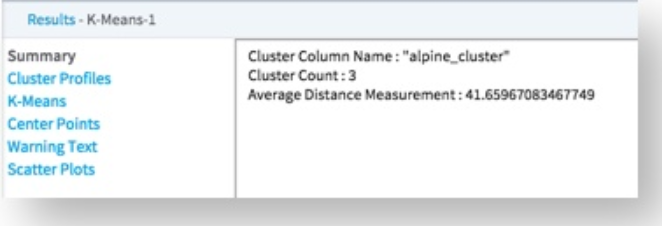
Running the K-Means analysis produces the following results:
The Summary results show the number of clusters, as defined by the K value selected, and the Average Distance Measurement of 41.66, which has "minutes" as the units of measure for the cell phone usage.
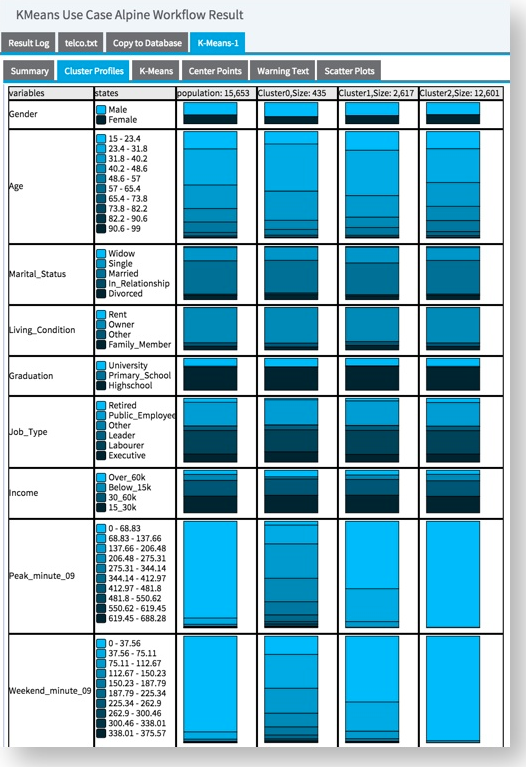
The Cluster Profiles tab displays the different natural states for each of the usage metric variables and the profile for each cluster group in those states.
In this example, Cluster0 has a variety of users falling into the different number of usage minutes groupings (and the lowest user population of 435 users). Cluster1 has only low usage users for Peak_minutes and a small fraction of 2nd lowest usage groupings for Weekend_minute and Offpeak_minute variables (and a population size of 2,617 users). Cluster2 has 100% lowest usage users for all three variables (and the highest population of 12,601 users).
Cluster1 and Cluster2 do not look very different from each other, but Cluster0 has unique characteristics, with a higher percentage of overall cellphone usage.
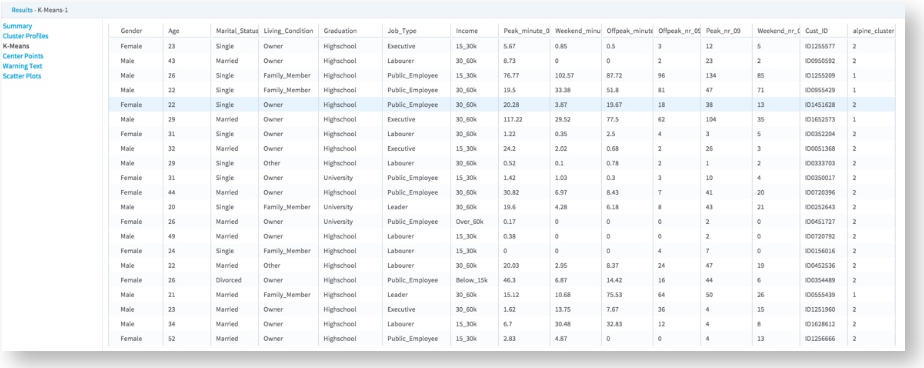
The K-Means tab displays the assignment of each individual Cust_ID (cellphone user) to a particular cluster. This assignment information could be very valuable for targeting a marketing campaign that, for example, at only Cluster0 users who show the highest usage levels overall.
The Center Point tab displays the center point values for the cell phone usage of all three clusters. For example, Cluster0 has a center of 205 Peak_minutes, 92 Weekend_minutes, and 141 Offpeak_minutes. Cluster2 has a center of only 9.2 Peak_minutes, 5.5 Weekend_minutes, and 6.5 Offpeak_minutes.

The Cluster tab displays the different usage metric variables charted against each other with the clusters shown in a different color. For this example, Cluster0 has the widest scatter of data points with the highest usage values. Cluster1 fits in the middle and Cluster2 has the lowest usage values.

This Cluster graph can be displayed using a different combination of the variables to see how the clustering looks across different variable dimensions. For example, choosing the Y Axis to be Peak_minutes with the X Axis as Weekend_minutes shows the following results.
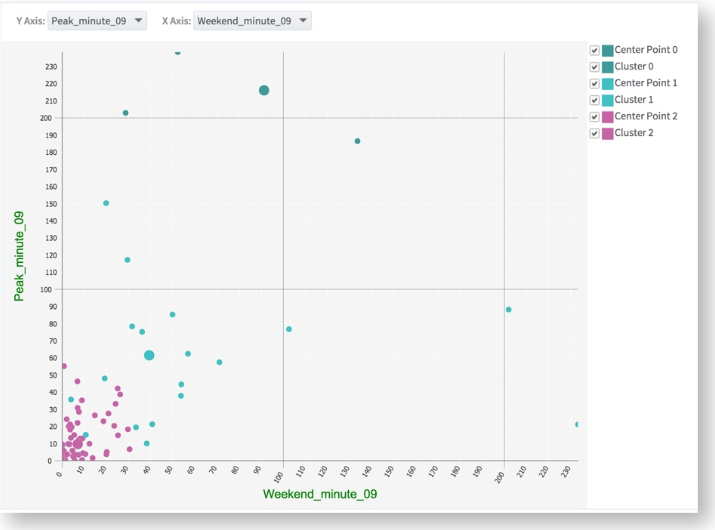
The clusters seem to be even more distinct when involving the Weekend_minutes dimension.
Since K needs to be determined in advance for K-Means, the modeler might want to experiment with varying the K amount in order to see if the Distance value is decreased or if the clusters show more natural groupings or not.