Lift (HD)
Visualizes the performance of a classification model. It applies in general to classification models (for example, CART, Decision Tree, Logistic Regression, Naive Bayes, Neural Network, and Alpine Forest).

Information at a Glance
| Category | Model Validation |
| Data source type | HD |
| Sends output to other operators | No |
| Data processing tool | MapReduce |
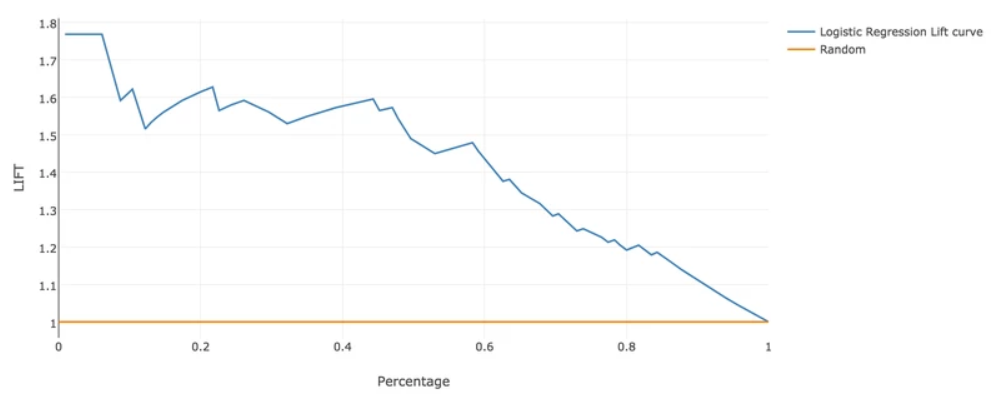
While a cumulative gains chart shows the total number of events captured by a model over a given number of samples, a lift curve shows the ratio of a model to a random guess. Lift charts show how a model performs compared to random guessing given x number of samples.
For example, suppose a population has an average response rate of 1%, but a certain model has identified a segment with a response rate of 10%. That segment has a "lift" of 10.0 (10%/1%).
By ranking quantiles of data by lift, you can see which areas have the most lift and thus which the model performs best on. For more information and examples about lift, see here.