Alpine Forest Evaluator
Provides model accuracy data, a confusion matrix heat map that illustrates the classification model's accuracy for each possible predicted value, and an error convergence rate graph.

Information at a Glance
The Alpine Forest Evaluator operator is an Alpine Forest model evaluation operator, similar to the Goodness of Fit evaluator, but more graphic in nature.
Algorithm
| Predicted | a is the number of correct predictions that an instance is negative, b is the number of incorrect predictions that an instance is positive, | |||
| Negative | Positive | |||
| Actual | Negative | a | b | c is the number of incorrect predictions that an instance is negative, and d is the number of correct predictions that an instance is positive. |
| Positive | c | d | ||
Like the Confusion Matrix operator, the Alpine Forest Evaluator operator also calculates several standard accuracy terms (See Confusion Matrix for more details).
- The accuracy (AC) is the proportion of the total number of predictions that were correct.
- The recall or true positive rate (TP) is the proportion of positive cases that were correctly identified.
- The false positive rate (FP) is the proportion of negative cases that were incorrectly classified as positive.
- The true negative rate (TN) is defined as the proportion of negative cases that were classified correctly.
- The false negative rate (FN) is the proportion of positive cases that were incorrectly classified as negative.
- Finally, precision (P) is the proportion of the predicted positive cases that were correct.
The Alpine Forest Evaluator also calculates an error rate in order to generate the error convergence graph. This indicates the misclassification rate of the model, which is simply 1 - accuracy (AC). This can also be computed as:

Restrictions
The Alpine Forest Evaluator operator must be connected to the Alpine Forest Classification operator and a data set from a preceding operator.
Output
- Visual Output
- The Alpine Forest Evaluator operator produces classification accuracy data, a graphical heat map, and a graphical tracking of the number of decision trees vs. error rates.
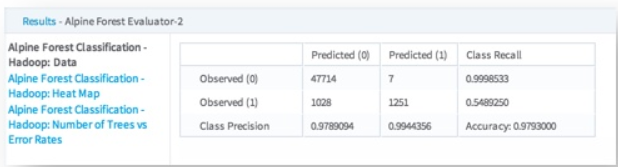
- Classification Accuracy Data Output
-
The data output provides the classification accuracy counts for every Observed/Predicted combination for each class. In the following example, the intersection of the Observed (0) row and Predicted (0) column indicates that 47,714 predictions of value 0 were correct, while the Observed (0)/Predicted (1) cell indicates the model predicted 1 instead of 0 only 7 times. So for predicting the class of 0, the class recall was 99.98% correct.
However, the Observed (1)/Predicted (0) cell indicates 1,028 instances of the model incorrectly predicting 0 for actual values of I and the Observed (1)/Predicted (1) cell indicates the model predicted 1 correctly 1,251 times, giving an accuracy (class recall) for predicting 1 of 54.89%.
Overall, the Alpine Forest Classification model's accuracy, in this example, is calculated to be 97.93% accurate.
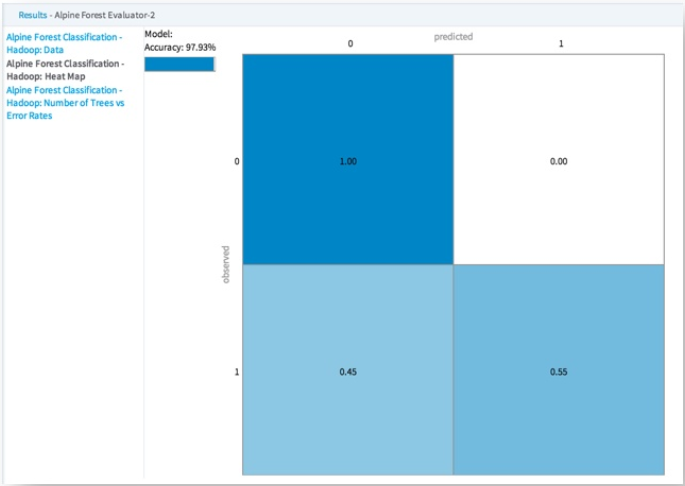
- Heat Map
-
A Confusion Matrix heat map displays information about actual versus predicted counts of a classification model.
The following example shows a Confusion Matrix heat map for an Alpine Forest model. In this case, it is evident that the model performs best when predicting the value 0 with 100% accuracy. However, the accuracy drops for predicting the value 1, being correct only 49% of the time.
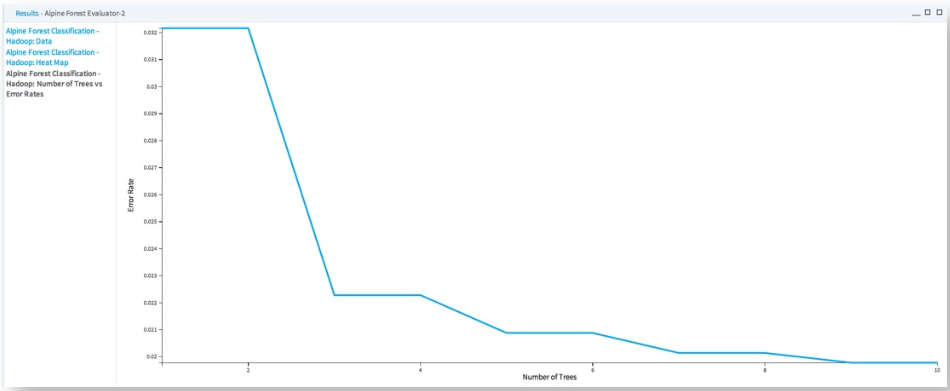
- Number of Trees vs. Error Rate Graph
-
Displays the error rate as the number of trees increases. This illustrates the Alpine Forest model's error convergence rate.
The following example illustrates how such a graph is useful for determining the number of decision trees needed in the Alpine Forest model in order for the error rate to be at its lowest. In this case, once there are nine decision trees, the error rate falls to 0.00%.