You can use the Classification Threshold Metrics operator to determine the prediction threshold that determines what the predicted class is, based on the probabilities that the model outputs.
Many classification models actually output a "score" (often a probability) for each class, where a higher score indicates higher likelihood. If we take the example of a binary classification, the model can output a probability for each class:
P(Y=1|X) and
P(Y=0|X).
Instead of simply taking the higher probability, there can be some cases where the model might need to be tuned so that it predicts only a class when the probability is very high (for example, only block a credit card transaction if the model predicts fraud with >90% probability). Therefore, there is a prediction threshold that determines what the predicted class is, based on the probabilities that the model outputs.
The following table provides the metrics that are available with the
Classification Threshold Metrics operator.
TP = True Positive, TN = True Negative, FP = False Positive, FN = False Negative
| Metric
|
Definition
|
| Recall
(proportion of positive cases that were correctly classified)
|

|
| Precision
(proportion of positive predicted cases that were correct)
|

|
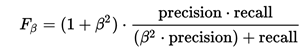
| F-Measure
(for specified β, measures the effectiveness of retrieval with respect to a user who attaches β times as much importance to recall as precision)
|
|
| False Positive Rate
(proportion of negative cases that were incorrectly classified as positive)
|

|
| Cumulative Count
(number of cases that were predicted positive for the corresponding confidence threshold)
|
|
| Cumulative Count (Percentage)
(percentage of cases that were predicted positive for the corresponding confidence threshold)
|
|
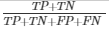
| Accuracy
(proportion of cases (positive and negative) that were correctly classified)
|
|
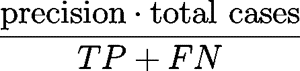
| Lift
(measures how a model performs compared to random guessing for a specific segment. For example, suppose a population has an average response rate of 1%, but a certain model has identified a segment (here the population predicted positive, with confidence_score > confidence_threshold) with a response rate of 10%. Then that segment has a lift of 10.0. (10%/1%))
|
|
| Kolmogorov-Smirnov (KS)
(evaluates the performance of a classification model by measuring the degree of separation between the positive and negative distributions. KS falls between 0 and 1, and the higher the value, the better the model is at separating the positive from negative cases.
If KS = 1, the confidence threshold partitions the population into two separate groups (one group contains all the positives and the other all the negatives)
If KS is close to 0, the model cannot differentiate between positives and negatives.
|

|
Copyright © 2021. Cloud Software Group, Inc. All Rights Reserved.