Running a Touchpoint
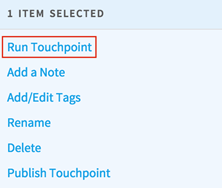
Once you've tested your touchpoint and are happy with the results, you can run it from the workspace screen or by clicking Run in the upper right of the touchpoint configuration screen.
Running a touchpoint is optimized so that it runs only the operators necessary to produce your chosen results.
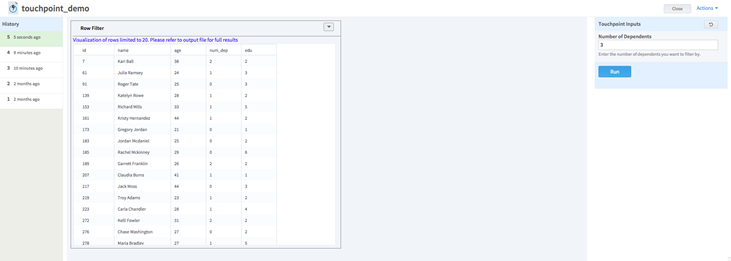
- History shows the history of this touchpoint's previous runs. You can see which parameters and outputs were used in previous runs. This is useful for adjusting parameters or running similar jobs.
- Outputs is the main window where outputs (tables, graphs, etc.) from the touchpoint are displayed.
- Inputs contains the touchpoint inputs. This is where you interact with the touchpoint.

Each time you run the touchpoint, a new entry is recorded and saved in the history panel on the left. Select an entry to display the results of that particular run. You can download the results as well. Click the pencil icon on the history entry to add a description for that particular run.
Action Menu
You can select Actions from the touchpoint run screen to view the result log, download the results as an HTML report, or place the results in a separate tab. For a published touchpoint, you can also choose to share the results with another workspace you are a member of.
- Share These Results
- Share these results allows you to share the results of this touchpoint run with another workspace. You must be a member of the workspace to share with them.
- View Results Log
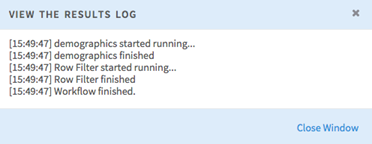
- View the results log shows the workflow log from running the underlying operators. The log shows only the operators that were run leading up to the operator selected for the touchpoint, skipping other branches and leaf operators. If there are any errors, the workflow log reflects the same. This view is useful for troubleshooting.
- HTML Report
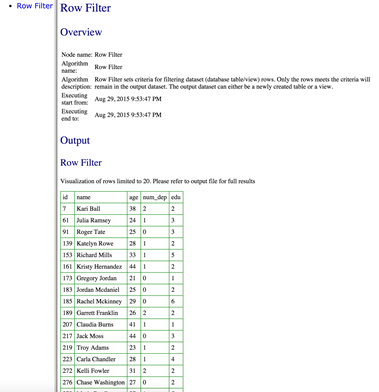
- Save report (HTML) downloads a .zip file that includes a folder of resources and an index.html. Here is an example:
- View Results in Full Window
- This action places results in a separate browser tab.


