Workflows
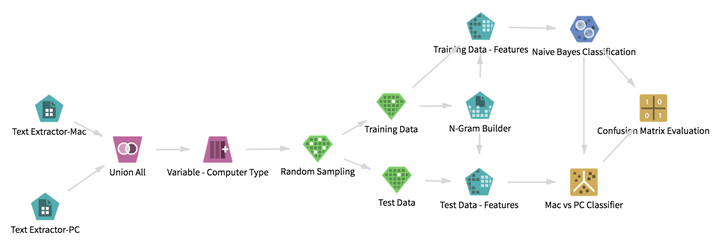
Model your analytics process with a directed graph of operators called a workflow. Workflows combine data sources and operators (algorithms and transformations).
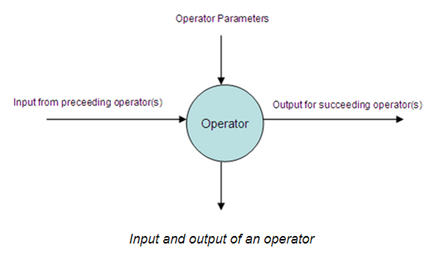
Each operator takes input from the preceding operator(s) or data source(s), performs its task, and produces output for the succeeding operators. Operators have parameters that can be configured by the user. These parameters can affect everything from the columns to analyze to the Spark settings to fine-tune your job's performance. The application performs validation checks when it creates connections between operators and configures their parameters.
At runtime, information produced from an operator is passed to its succeeding operator(s). This forms an information flow through the operators that can be inspected and analyzed at any intermediate point.
When you run a workflow, Team Studio checks the inputs and any needed dependencies on each operator as execution reaches that point in the graph. If required parameters are missing, the workflow does not start and errors are reported. Additionally, the title of the offending operator is displayed in red.
When an operator finishes its task, Team Studio gets any output and displays it as a section in the workflow result screen.
- Workflow Editor
Workflows - collections of operators and data - are created and edited in the Team Studio workflow editor. - Workflow Actions
The following workflow actions are available from the Actions drop-down menu. - Workflow Menu
The menu for the Workflow canvas contains the controls to run, stop, clear, save, and revert changes to the workflow, as well as other actions. - Data Explorer
The data explorer shows data sources you have connected to the selected workflow. There is no need to know whether they are Hadoop data sources or databases: they are all browsable from this dialog box. - Operator Explorer
From the Operators explorer, you can filter and search through the list of available operators. - Operator Help
Team Studio offers four ways of getting help on an operator. - Creating a New Workflow
From the Work Files tab, users can create a new workflow within their workspace. - Explore Visual Results
Team Studio uses Plotly charts and graphs to enhance how you interact with your data. Plotly is available to the Explore operators, to many Model operators, and for all associated results shown in Touchpoints and HTML reports. The topics in this section discuss tips and tricks to use these visualizations to the fullest extent. Note the location of each of these features in the diagrams. - Spark Optimization for Data Scientists
Many operators in Team Studio run using custom Spark algorithms. While many Spark implementations come with default configuration settings, these might not be optimal for every use case. - Deploying Models and Workflows
Once a workflow is developed, there are several ways that it can be deployed or operationalized. - Preview and Visualize Data
We provide several data visualization and exploration options in the contextual menu of any data source. Right-click the data operator to see the options. - Running a Workflow
To run a workflow, open the flow in the editor and click Run in the upper toolbar. - Viewing Workflow Results
When a workflow is run, the Results Console is displayed below the Workflow canvas. - Workflow Variables
It is possible to override the default workflow parameters using workflow variables.


