T-Test - Single Sample
Tests for statistical significance between a set of numeric values (from one column) and a known mean. This operator allows one to compute the test across several different sample columns with one operator.

Information at a Glance
| Category | Model Validation |
| Data source type | HD |
| Sends output to other operators | Yes |
| Data processing tool | Spark |
The single sample t-test is used to test whether a sample population has a significantly different mean from the known population mean.
For information about Student's t-distribution, see https://en.wikipedia.org/wiki/Student%27s_t-distribution.
Algorithm
The means and variances for all of the test statistics are computed using Spark's MultivariateStatisticalSummary object, but the t-tests themselves are computed from Java's commons-math library.
Configuration
Output
- Visual Output
- Each row represents a column selected in the
Sample Columns
parameter.
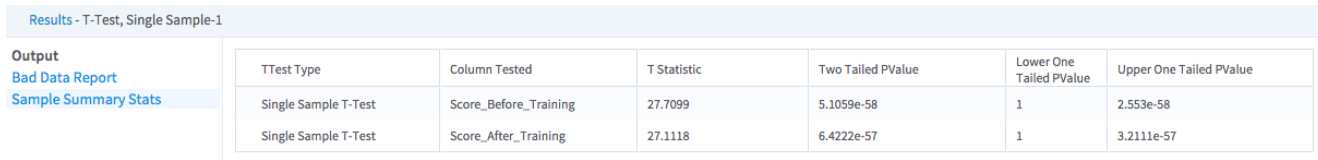
See Single Sample T-Test Use Case for example data on a puppy training program that illustrates use of the single sample t-test. In this case, we see that we have above average puppies since the Upper One Tailed PValue for the Score_Before_Training column is very close to zero, and that after training the puppies, they are still above average since the Upper One Tailed PValue for the Score_After_Training column is also close to zero.
- Data Output
-
- T Statistic - A value computed based on the average and variance. The higher the magnitude of the t-statistic, the higher the difference between the means.
- Two Tailed PValue - The sum of the area under the Students t-distribution above the absolute value of the t-statistic and below the inverse of the t-statistic. A higher value indicates a greater absolute difference in the sample compared. We usually reject the null hypothesis if p < 0.05.
- Lower One Tailed PValue - The area under the Student's t-distribution between negative infinity and the t statistic. A lower p-value indicates that sample a is less than sample b. We usually reject the null hypothesis if p < 0.05.
- Upper One Tailed PValue - The area under the Student's t-distribution between positive infinity and the t statistic. A lower p-value indicates that sample a is greater than sample b. We usually reject the null hypothesis if p < 0.05.