Schematic Representation of Enterprise Deployment Health Check
The following is a schematic diagram showing a typical Enterprise Deployment Health Check run for each of the targets listed in the previous sections.
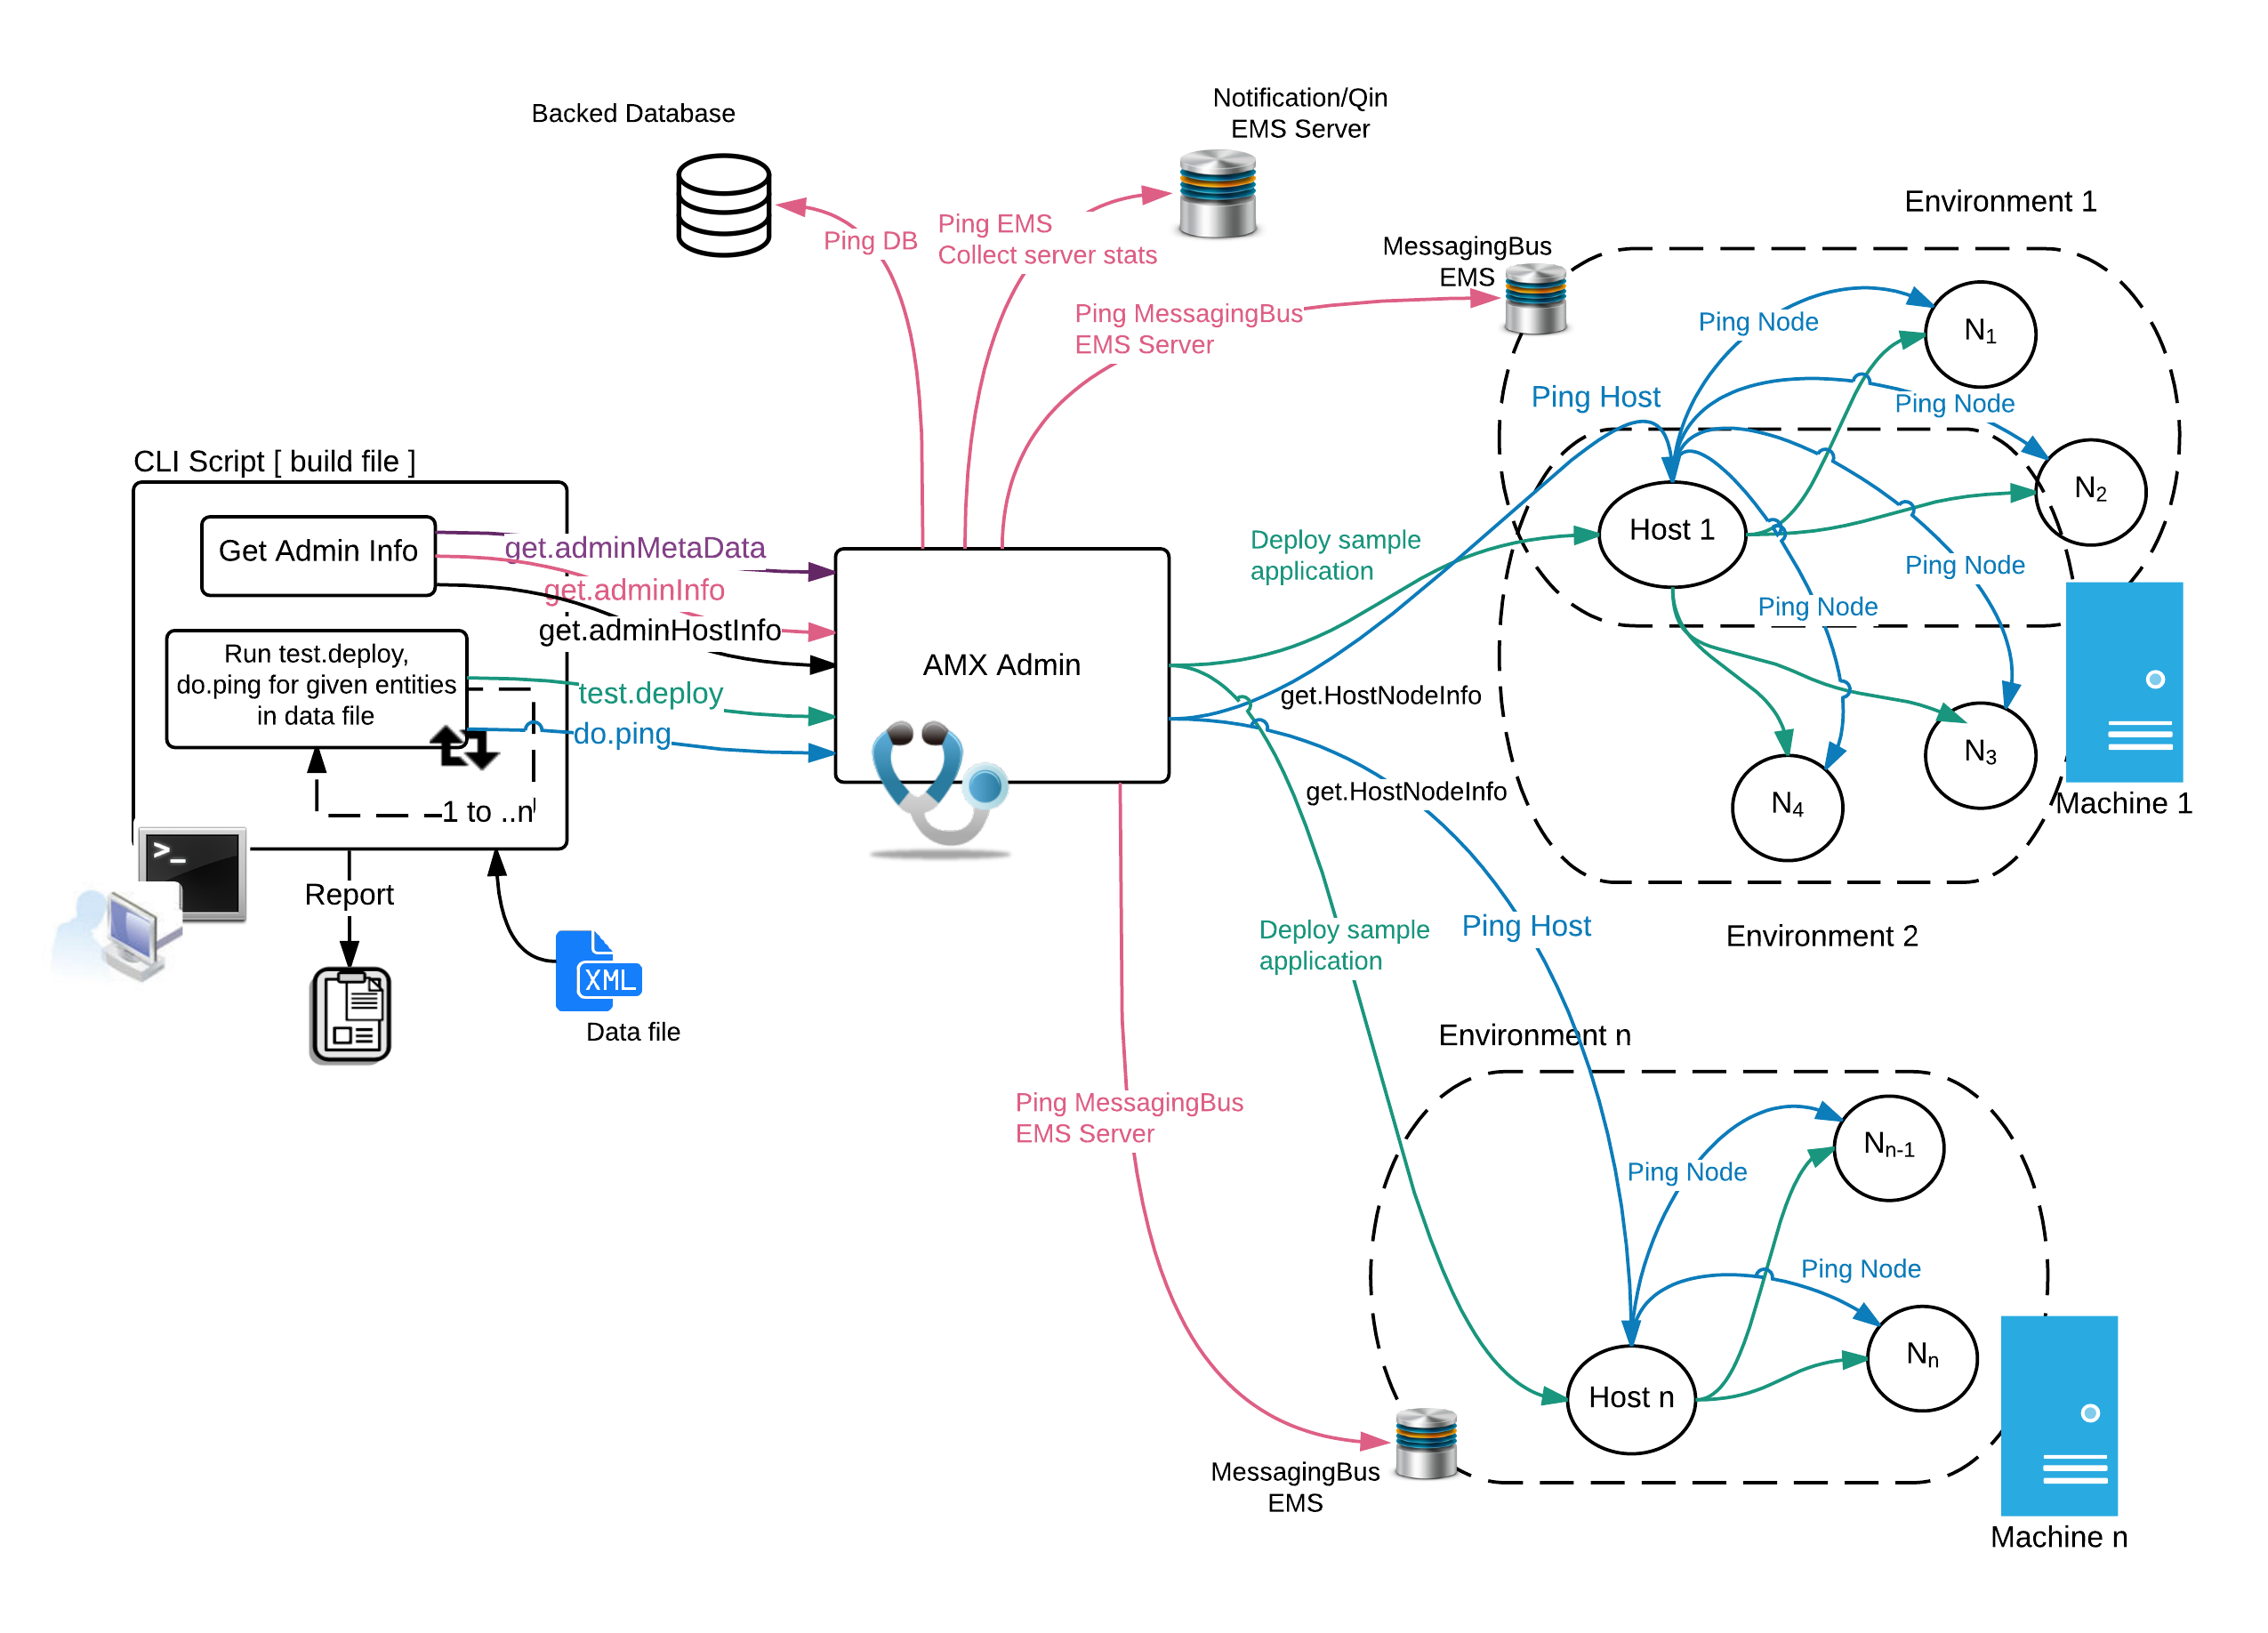
This schematic consists of three main components:
- TIBCO ActiveMatrix Administrator CLI script, that initiates the Enterprise Deployment Health Check.
- TIBCO ActiveMatrix Administrator, that is responsible for running and orchestrating the various targets of Enterprise Deployment Health Check.
- One or more TIBCO ActiveMatrix Runtime Environments.
The different flows (distinguished by different colors in the schematic diagram) are described as follows:
- "get.adminMetaData": As seenin the schematic diagram, this is a TIBCO ActiveMatrix Administrator-only operation. Once the configuration data of TIBCO ActiveMatrix Administrator is collected, the control returns to the CLI script script. (Not shown above). In case of a Replicated TIBCO ActiveMatrix Administrator setup, this flow connects to the other TIBCO ActiveMatrix Administrator to gather server configuration information.
- "get.adminInfo": As seen in the schematic diagram, in this flow, the TIBCO ActiveMatrix Administrator connects to and performs a “test connection” on its backend database and Notification Server (Qin) and performs a “test connection” on the Messaging Bus Configuraiton of each ActiveMatrix Envrionment. It also connects to its own Host (SystemHost in case of SystemNode) and gathers some real-time pool (Database, LDAP) information. If the TIBCO ActiveMatrix Administrator was configured with TIBCO SPM Probe, the connection between the SPM Probe and it’s own EMS Server is also tested.
- "get.adminHostInfo": As seen in the schematic diagram, in this flow, in addition to the functionality of "get.adminInfo", a HPA/JMX call is made to each Host in the TIBCO ActiveMatrix Enterprsie to collect information. Each Host that is contacted by the TIBCO ActiveMatrix Administrator to collect informaton, in turn, makes a HPA/JMX call to each of its managed Nodes to collect information about the Node.
- "test.deploy": As seen in the schematic diagram, this flow deploys a Sample Application to each of the selected Nodes in the TIBCO ActiveMatrix Enterprise. In the scenario where the main target is "health.ent", the Sample Application is deployed on all Nodes in Enterprise. The standard deployment process is followed for the Sample Application, that is, it’s Deployed with Start, followed by Undeploy of the Applicaton and concluded with the deletion of the Application Template.
- "do.ping": As seen in the schematic diagram, this flow is the same as "get.adminHostInfo", but in this case, the Hosts and Nodes do not collect any information; they simply revert with a Success upon receiving the request. The TIBCO ActiveMatrix Administrator calculates the time taken for each Host and Node to respond, and records the time as as “ping” time.
At the end of each of flow, regardless of the PASSED or FAILED status, TIBCO ActiveMatrix Administrator CLI creates a report file that contains the output of each Enterprise Deployment Health Check flow.
Copyright © Cloud Software Group, Inc. All rights reserved.