Components
Service Performance Manager components include clients running the services, a messaging server, the SPM Server, a database server, and a dashboard.
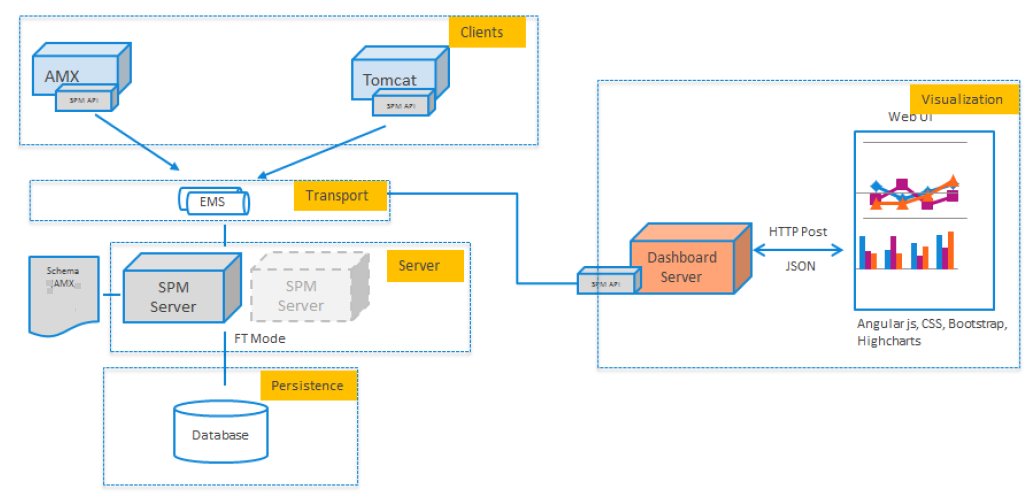
Here is a brief description of each component:
- Clients
- Systems or processes that want their services monitored. For example, in a TIBCO ActiveMatrix environment, the development and administrator nodes that have ActiveMatrix service probes installed on them which publish the service hits, faults, execution time information using the Client API.
- Transport
- The transport medium that helps publish facts to and broadcast messages from TIBCO Service Performance Manager. TIBCO Server Performance Manager supports TIBCO Enterprise Message Service (EMS) as the transport.
- The TIBCO Service Performance Manager Server
- The hub of all activities. The SPM Server is responsible for all the computations on the metrics and broadcasting information to the participating nodes.
- Persistence
- The Database managed by TIBCO Service Performance Manager to persist the computed aggregation results and optionally raw facts published to TIBCO Service Performance Manager.
- Dashboards
- The purpose of SPM Dashboard is to support creation of SPM Rules, display and filter alerts, display the hierarchies and dimensions information over a web UI.
TIBCO Service Performance Manager distributes sample probes in SPM_HOME/<version>/examples/probes.
For the purposes of component illustration, the architecture diagram uses the TIBCO ActiveMatrix environment. Any software component, with a probe enabled in it, can use the SPM Client API to publish relevant service-related statistics to the SPM Server.
Copyright © Cloud Software Group, Inc. All rights reserved.