Project Life Cycle
The project workflow of TIBCO Service Performance Manager is simple - starting from identifying resources, to monitoring their behavior, and to sending out alerts.
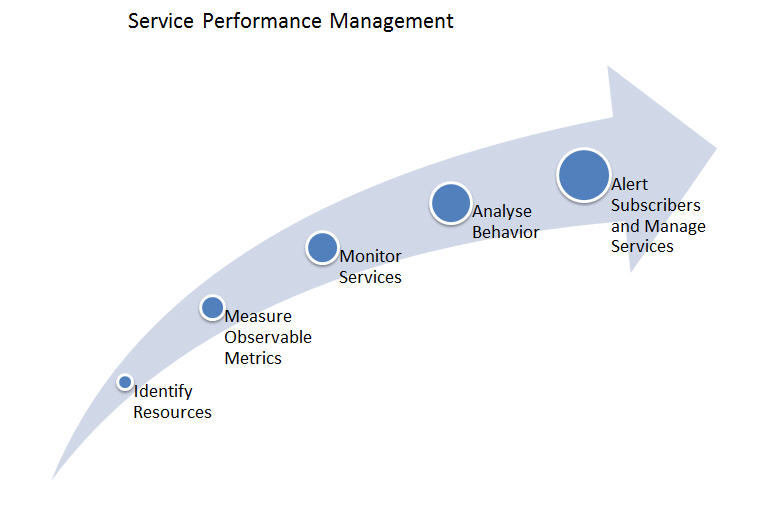
The major steps involved in monitoring and managing service level performance are as follows:
Measure Observable Metrics
When all the services are identified, the next step is to measure the metrics values.
Some of the service metrics that can be measured are as follows:
Some of the infrastructure metrics that can be measured are as follows:
Monitor Services
Metrics are displayed in a web-based dashboard. These views are updated real time as and when there are changes. You can use different views to monitor performance at various levels such as by environments, nodes, applications, and deployed services/references.
Analyze Behavior
The data is computed real time by computation and aggregation over time buckets as and when the metrics and their values are gathered.
The following statistical and time-based analyses are performed:
Manage Services Based on SLAs
Based on the SLA between service consumers and providers, a set of rules can be defined. You can customize and monitor these rules. This way, both the consumer and the provider can track service execution and ensure adherence to service level business agreements.
Send Alerts
You can define threshold conditions on metric values and set rules based on these metrics. When these threshold levels are reached or conditions defined in a rule are met, alerts are sent or actions get triggered.
Alerts can be displayed in the dashboard as visual indicators. If a service is not performing as expected, you can take corrective measures based on the alerts received.