Setting Condition
After you select the hierarchy of attributes to apply the rule, you can specify the metrics to be monitored.
Procedure
-
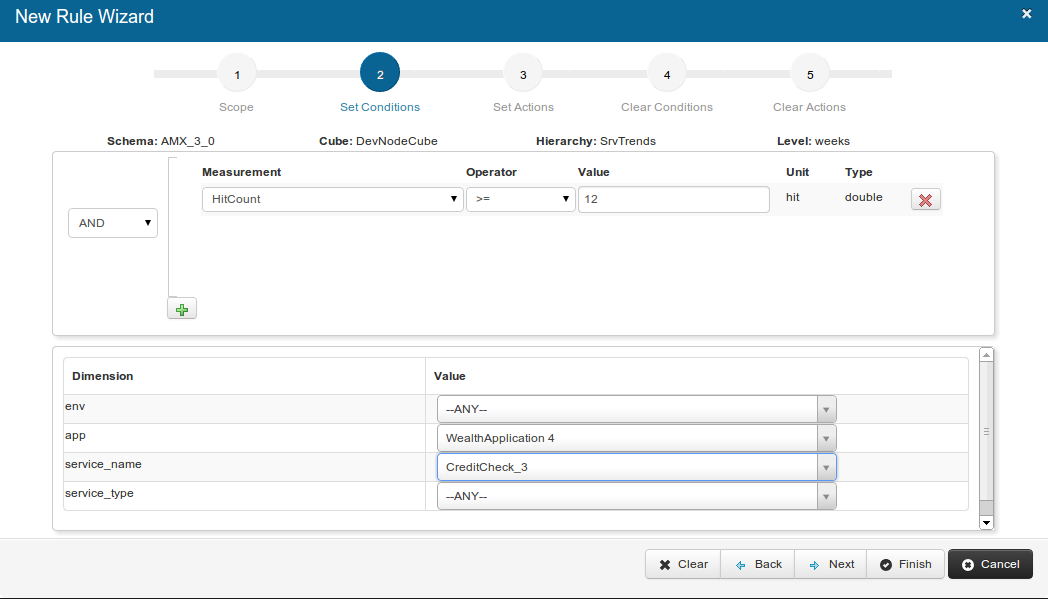
In the
Measurement field, select a metric for measurement.
Based on the Hierarchy that you selected, the following metrics are available for measurement:
Measurement Description AssetStatus
Select to check the status of any selected asset. The status is either Red (0) or Green (1). AvgJVMTotalMemory
Select to measure the total JVM memory in bytes for the selected <dimension>. AvgJVMUsedMemory
Select to measure the used JVM memory in bytes for the selected <dimension>. HitCount
Select to measure the number of hits for the selected <dimension>. SuccessCount
Select to measure the number of successes for the selected <dimension>. FaultCount
Select to measure the number of faults for the selected <dimension>. AvgResponseTime
Select to measure the average response time (in milliseconds) of the selected <dimension>. - Select the Operator as ==,,=, <=, < to define a condition.
- Enter Value to satisfy the condition.
-
In the
Dimension field, select values for the displayed fields from the adjacent lists. The relevent fields from the following list are made available:
- env
- app
- service_name
- service_type
- binding_type
- binding_name
- node
- host
- operation_name
- resource_type
- resource_name
- client_ip
Note: The dimensions are available for selection based on the selected Hierarchy.Select the dimension based on your monitoring requirements. To monitor the performance of a particular service, select the service hierarchy such as |environment|application|service.
For example, to get an alert when a particular service is at fault, select SrvTrends and select a <service_name>, <application_name>, and <environment>.
- Click Next to set an action.
Copyright © Cloud Software Group, Inc. All rights reserved.