Custom Enterprise Health Check
Using Custom Health Check, you can run Test Deploy, Ping or Get Administrator and Host information for the environment or host that you select. You can even narrow down the tests by selecting only few of nodes in the environment.
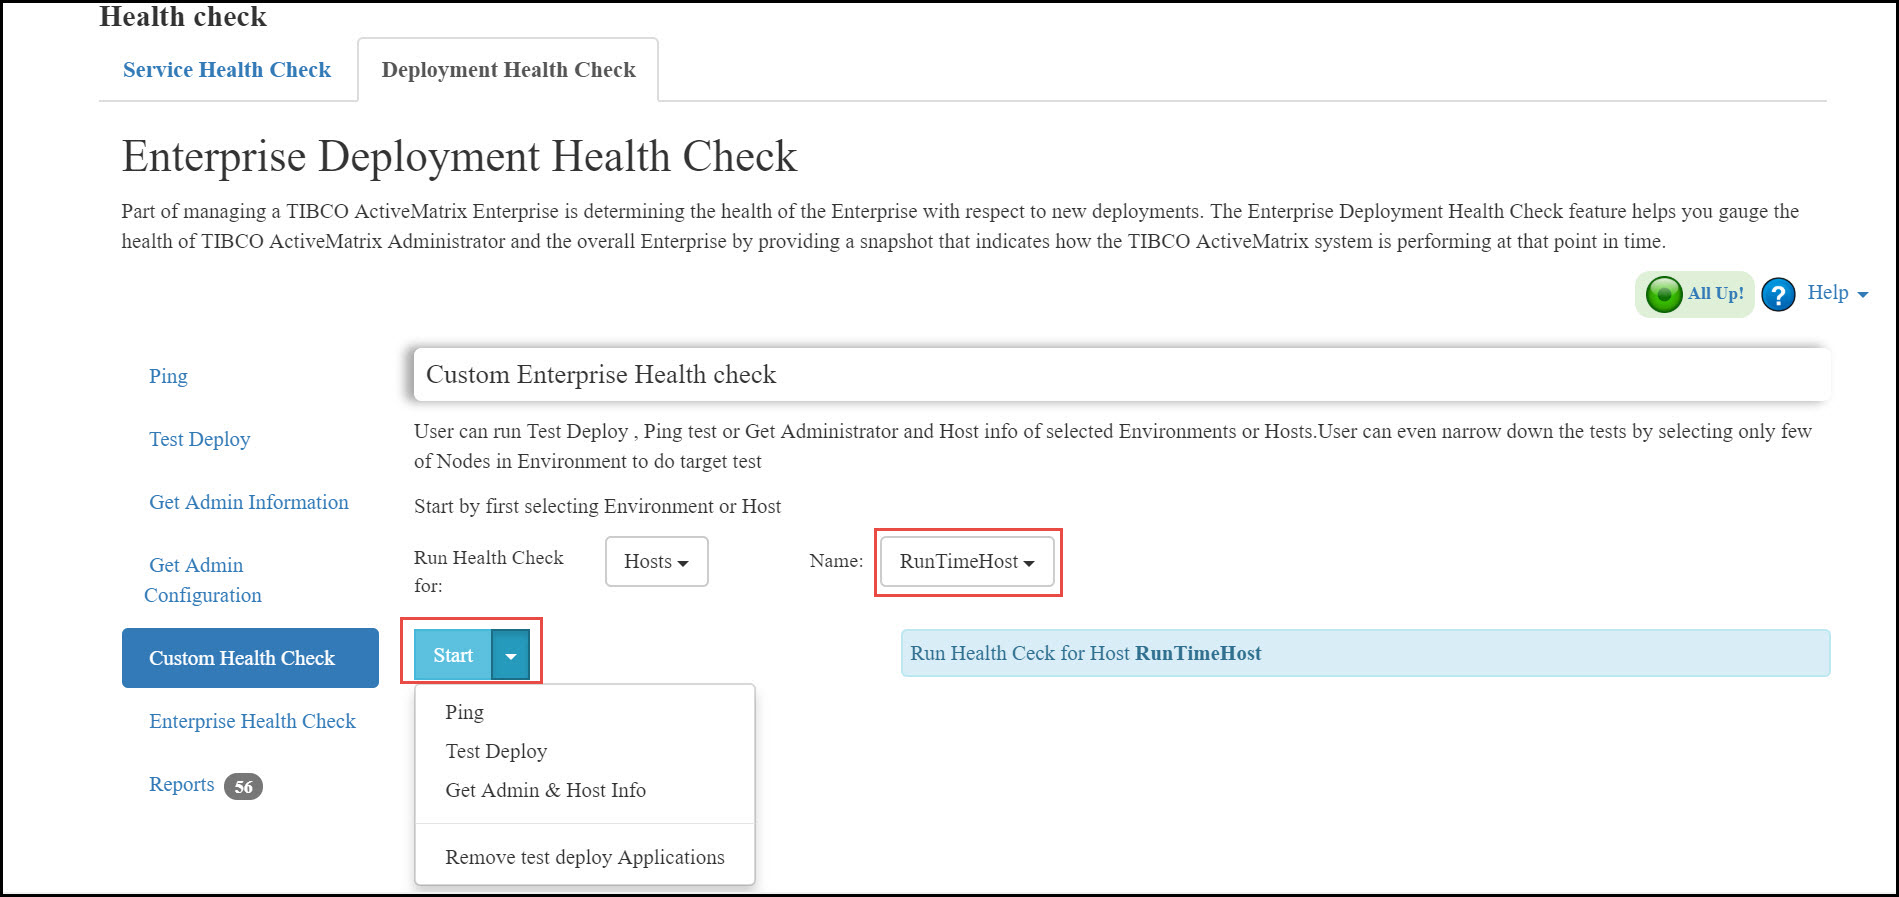
Running Custom Enterprise Health Check for Specific Host in the Enterprise
- To run health check tests for specific host, select Host from the Run Health Check For dropdown list.
- Select the Name of a host.
- Select the health check test to run from
Start dropdown menu. It provides the following options:
- Ping: Ping selected host and all nodes managed by it.
- Test Deploy: Test Deploy for all the nodes managed by the selected host ( Deploy a sample application and then undeploy it).
- Get Admin & Host Info: Get all the Administrator information and collect JVM and Machine information from this selected host.
- Remove test deploy Applications: This option allows you to remove leftover sample applications that sometimes gets leftover during test deploy.
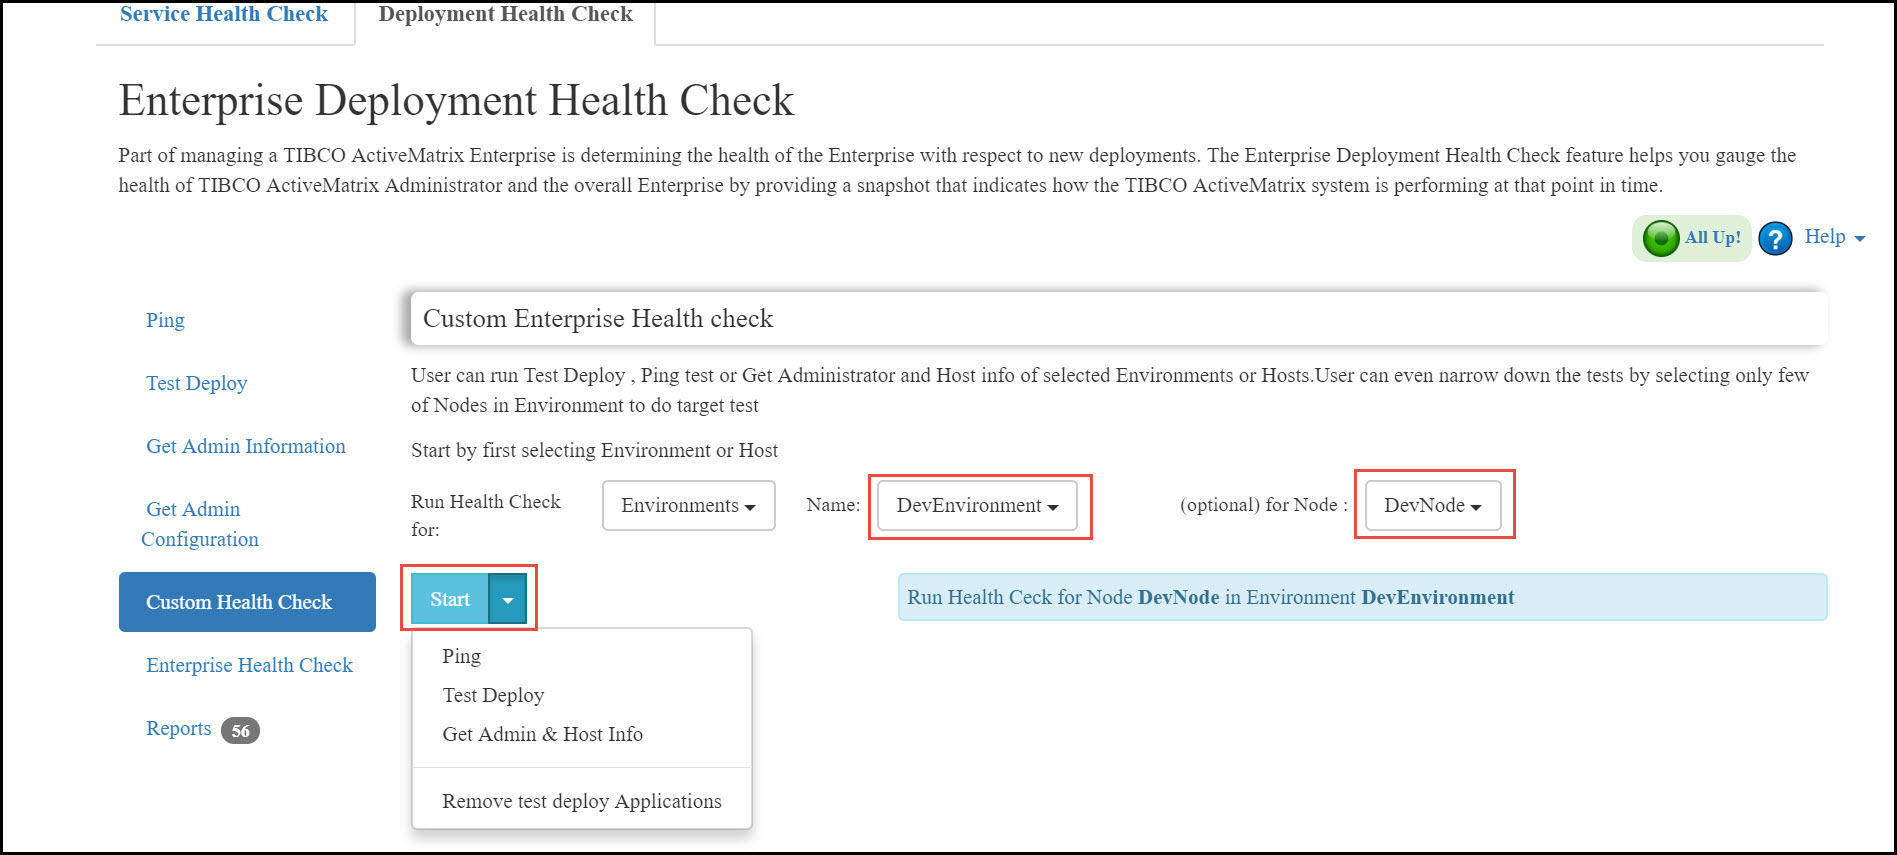
Running Custom Enterprise Health Check for Specific Environment in the Enterprise
- To run tests for specific Environment, select Environment from the Run Health Check For dropdown list.
- Select the name of an Environment.
- You can run health check for all nodes in the selected Environment or select the node for which you want to perform health check.
- Select a health check test to run from
Start list. It provides the following options:
- Ping: Ping nodes in the selected environment.
- Test Deploy: Test Deploy for all the nodes managed by the selected environment (Deploy a sample application and then undeploy it)
- Get Admin & Host Info: Get all the Administrator information and collect JVM and Machine information from all the hosts that are part of the selected environment.
- Remove test deploy Applications: This option allows you to remove leftover sample applications that are residue of a test deployment.
Custom Health Check Report
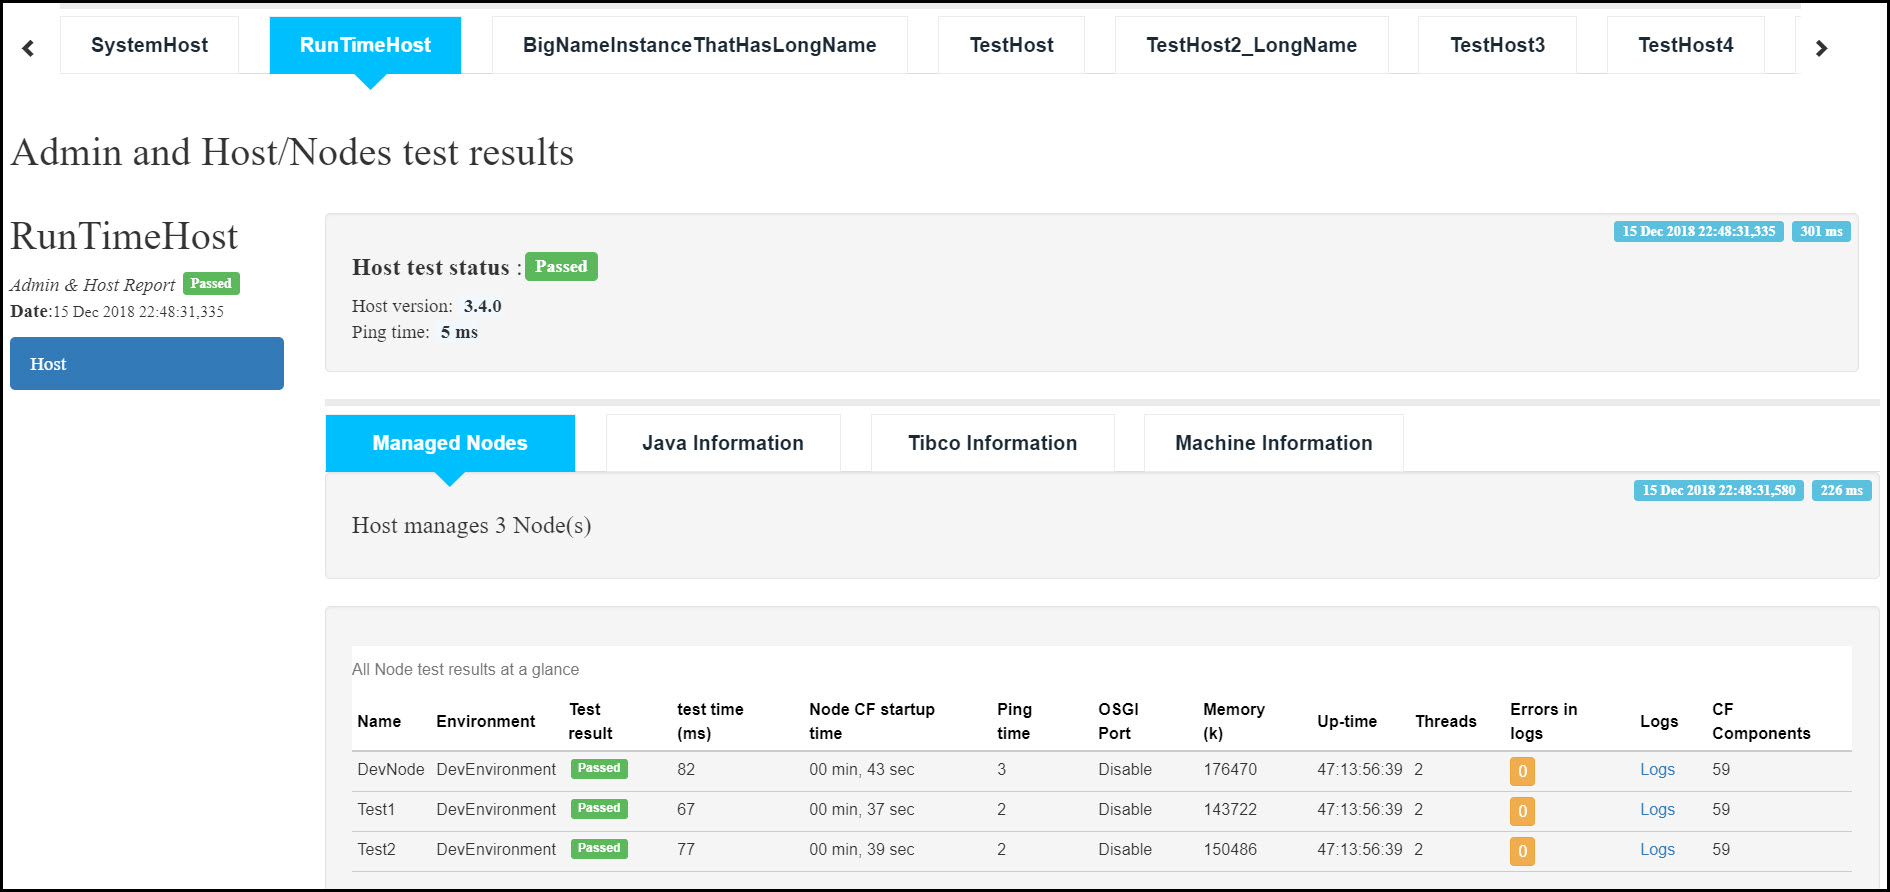
Get Admin & Host Information report for selected host:
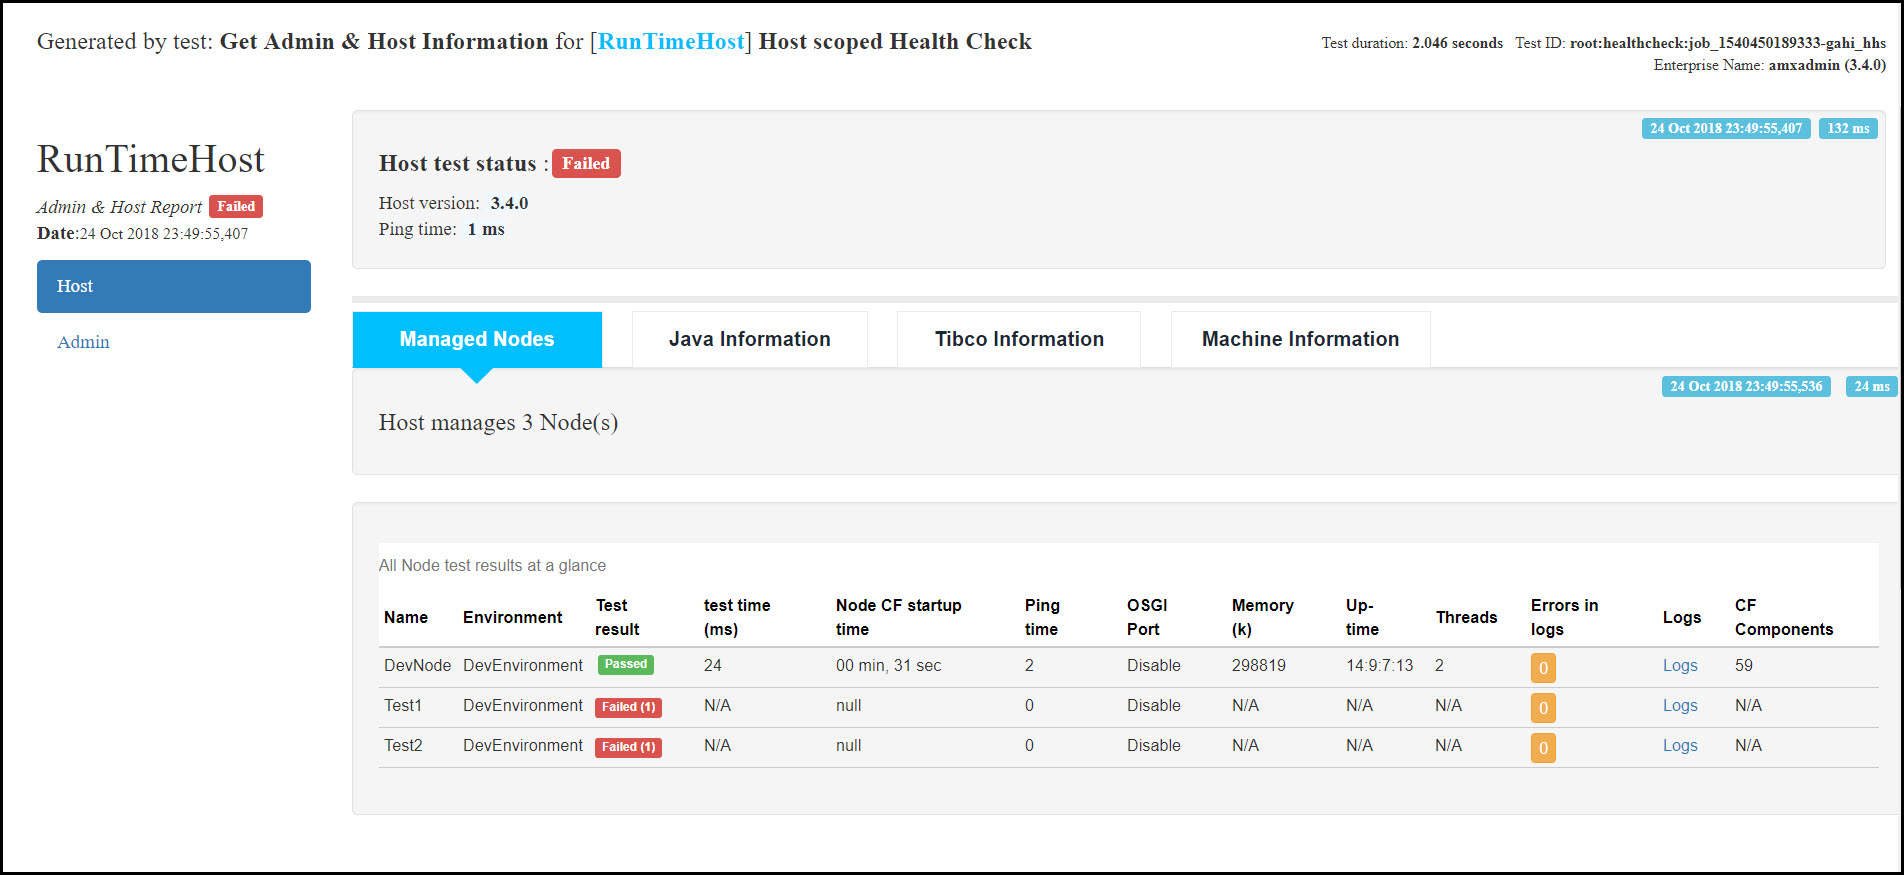
If the information in report is large, you can view all tabs of report in collapse and expand view. Click Flatten button in top right corner to view all tabs in collapse and expand view.
Get Admin & Host Information Report for a Selected Environment
This report is same as the one for selected host shown above, except it contains tabs for all hosts in the environment at top to navigate through.