Enterprise Tab
The Enterprise tab, as shown in the following screenshot, has five main sections: Administrator Entities, Enterprise Summary, Administrator Process, Machine Information, and Administrator Configuration. Each of these sections are further described in detail.
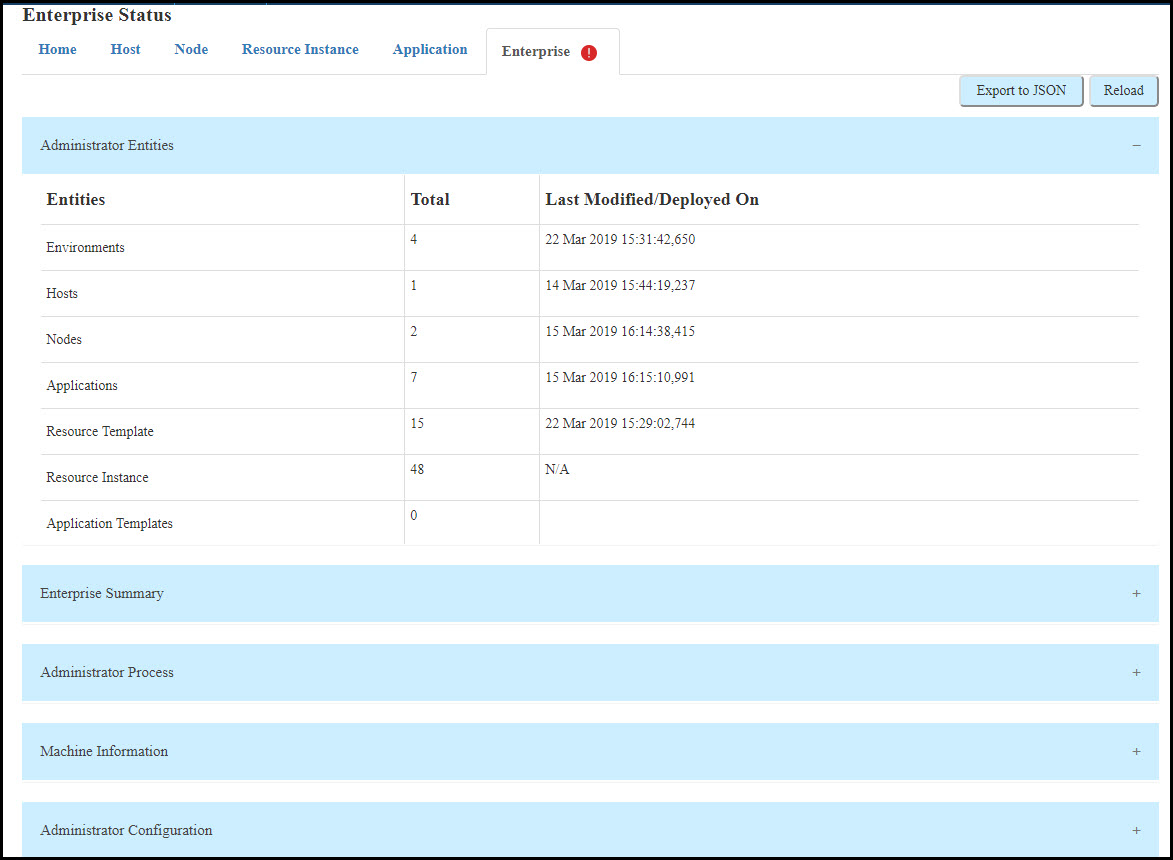
As shown in the above screenshot, a red icon beside the Enterprise tab indicates an error in the overall status of the enterprise. Click the icon to get more details on the error.
Administrator Entities
This section provides information about the total number of entities present on the ActiveMatrix Administrator and details of when they were last modified or deployed.
As shown in the above screenshot, the Administrator Entities section provides the following information:
Enterprise Summary
This section provides information about most of the number of entities running on enterprise with different combinations. It also provides most number of particular entity with machine name. The information in this summary can be used to distribute entities over an enterprise for better performance. Load sharing can also be improved using this data.
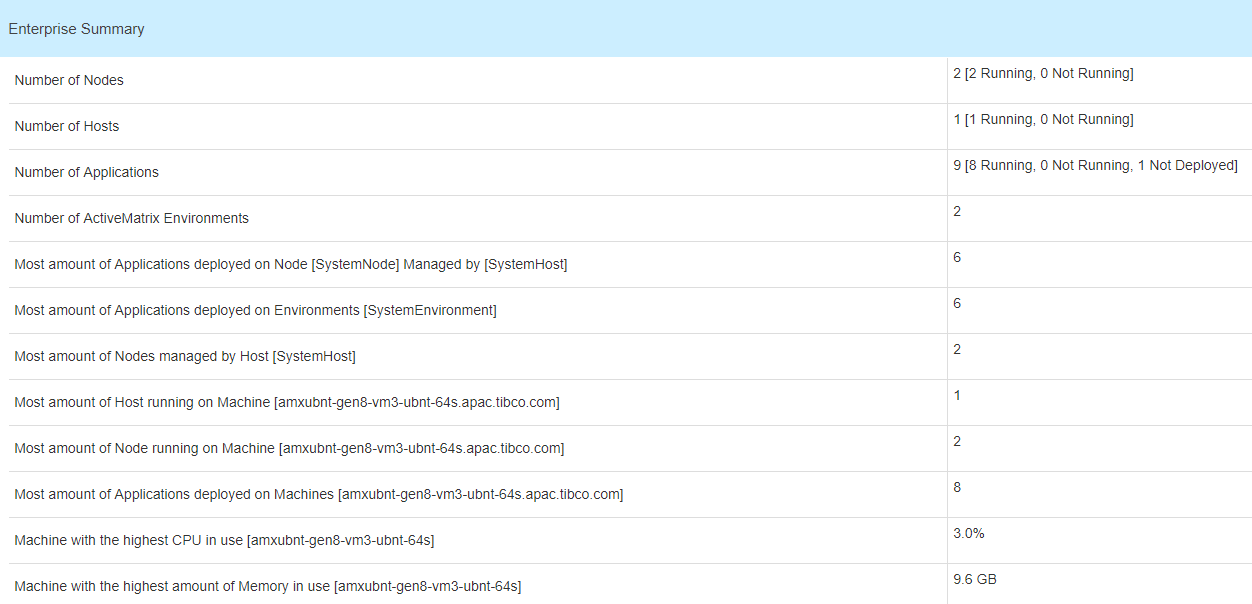
- Number of Nodes: Total number of Nodes in the "Running" and "Not Running" state.
- Number of Hosts: Total number of Hosts in the "Running" and "Not Running" state.
- Number of Applications: Total number of Applications in the "Running", "Not Running", and "Not Deployed" state.
- Number of ActiveMatrix Environments: Total number of ActiveMatrix Environments.
- Most amount of Applications deployed on Node[Node_Name] Managed by [Host_Name]: Highest number of Applications deployed on a Node/Host.
- Most amount of Applications deployed on Environments[Environment_Name]: Highest number of Applications on an Environment.
- Most amount of Nodes managed By Host[Host_Name]: Highest number of Nodes on a Host.
- Most amount of Host running on Machine[Machine_Name]: Highest number of Hosts running on a machine.
- Most amount of Node running on Machine[Machine_Name]: Highest number of Nodes running on a machine.
- Most amount of Applications deployed on Machine[Machine_Name]: Highest number of Applications deployed on a machine.
- Machine with highest CPU usage[Machine_Name]: Highest usage in percentage for machine.
- Machine with highest amount of memory in use[Machine_Name]: Highest memory used by machine.
Administrator Process
This section provides information related to the OS process of the ActiveMatrix Administrator (JVM), its start time and up time duration. This also includes JVM specific information.
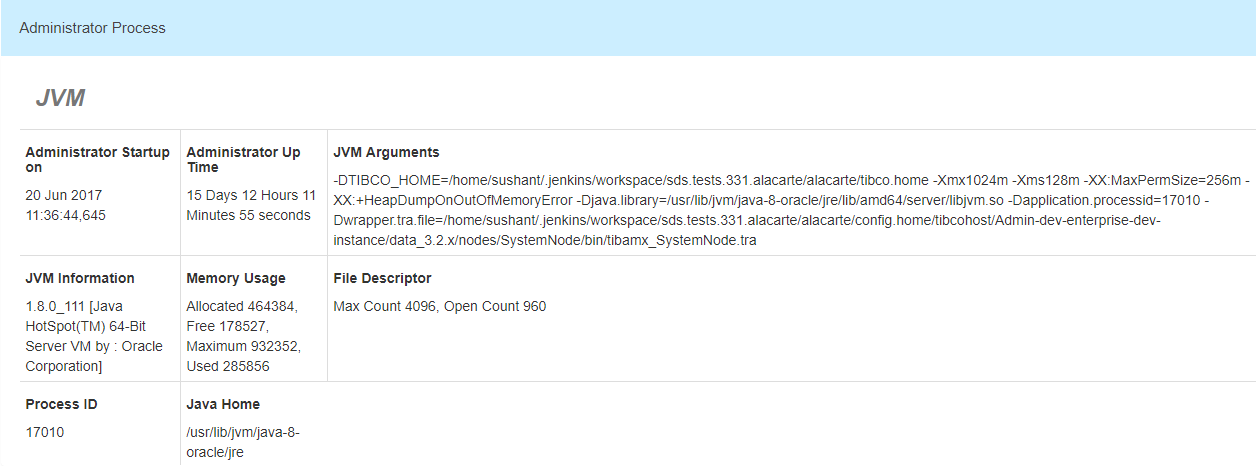
- Administrator Startup on: The date and time when the ActiveMatrix Administrator was created.
- Administrator Up Time: The duration for which the ActiveMatrix Administrator has been up.
- JVM Arguments: JVM arguments for SystemNode (Administrator Node).
- JVM Information: JVM information such as version number and so on.
- Memory Usage: Memory usage with details of allocated, free, maximum, and used values.
- File Descriptor: Values of Maximum Count and Open Count.
- Process ID: Process ID for JVM.
- Java Home: Location of Java home.
Machine Information
This section is machine-specific. It provides details such as machine name, username, CPU count, operating system, memory, and swap space.
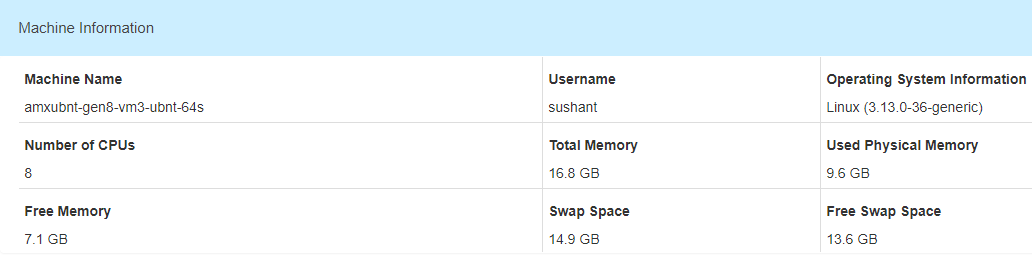
- Machine Name: Name of the machine
- Username: Name of the user logged in to the machine
- Operating System Information: Details about the operating system on the machine
- Number of CPUs: Number of CPUs on the machine
- Total Memory: Total memory of the machine
- Used Physical Memory: Total memory that has already been used
- Free Memory: Total memory available for use
- Swap Space: Total swap space
- Free Swap Space: Total swap space available for use
Administrator Configuration
This section has four sub sections. It provides information related to Administrator installation, configuration, shared directories, ping time, Database, and Notification Transport (Qin). This section of the page can be used to get information about directories that ActiveMatrix Administrator uses and also to optimize database pool size.
- General
- TIBCO_HOME: TIBCO_HOME of the SystemNode that runs this ActiveMatrix Administrator.
- CONFIG_HOME: CONFIG_HOME of the SystemNode that runs this TIBCO ActiveMatrix Administrator.
- Shared Folder: Shared folder used by ActiveMatrix Administrator to store runtime configuration data.
- Administrator Version: Version of TIBCO ActiveMatrix Service Grid.
- Primary Administrator: “Yes” indicates that the ActiveMatrix Administrator is a primary Administrator.
- Ping
- Database Ping: Time taken for the ActiveMatrix Administrator to ping the backend database.
- Qin Ping: Time taken for the ActiveMatrix Administrator to ping the Notification/Qin server.
- Total Notification Processed: Number of Qin notifications processed by the ActiveMatrix Administrator since restart.
- Database
- Qin
- URL: URL of the Qin Server.
- Username: The username used to connect to the server.
- Reconnect Attempt Delay: Time interval between successive attempts to reconnect to the server.
- Reconnect Attempt Count: Number of times a node attempts to establish a connection to the server before an error is returned.
- Server Version: Notification or Qin Server EMS version.
- Client Version: Version of the EMS client.