Node Details
The Node Details page displays the details of the selected node. You can select a different node to see its details using the View Node list near the Time Range Selector.
Based on the selected node and time period, the Node Details page displays information about the selected node in the following tables and charts.
Node Details
The Node Details table displays the following details:
| Column | Description |
|---|---|
| Node | Shows the selected node |
| Host | Shows the name of the host on which the selected node is running |
| Average Used Memory | The average JVM memory used by the selecte node over the selected time window |
| Average Total Memory | The average total JVM memory of the selected node over the selected time window |
Node HTTP Resources
The Node HTTP Resources table displays the following details:
| Column | Description |
|---|---|
| Resource Name | Lists the names of the HTTP resources
Clicking a resource opens the HTTP Resource Details page. |
| Resource Type | Shows the type of the resource as HTTP |
| Availability | Shows the availability of the HTTP resource as indicated by the status marker
For more information, see Asset Status. |
Node JDBC Resources
The Node JDBC Resources table displays the following details:
| Column | Description |
|---|---|
| Resource Name | Lists the names of the JDBC resources
Clicking a resource opens the JDBC Resource Details page. |
| Resource Type | Shows the type of the resource as JDBC |
| Availability | Shows the availability of the JDBC resource as indicated by the status marker
For more information, see Asset Status. |
Node JMS Connection Factory Resources
The Node JMS Connection Factory Resources table displays the following details:
| Column | Description |
|---|---|
| Resource Name | Lists the names of the JMS Connection Factory resources
Clicking a resource opens the JMS ConnectionFactory Resource Details page. |
| Resource Type | Shows the type of the resource as JMS Connection Factory |
| Availability | Shows the availability of the JMS Connection Factory resource as indicated by the status marker
For more information, see Asset Status. |
The Node ThreadPool Resources table displays the following details:
| Column | Description |
|---|---|
| Resource Name | Lists the names of the ThreadPool resources
Clicking a resource opens the ThreadPool Resource Details page. |
| Resource Type | Shows the type of the resource as ThreadPool |
| Availability | Shows the availability of the ThreadPool resource as indicated by the status marker
For more information, see Asset Status. |
The Services deployed on this Node table displays the following details:
| Column | Description |
|---|---|
| Service / Reference | Lists all the services or references deployed on the selected node |
| Type | Displays the type as service or reference |
| Binding | Shows the name of the binding on the service or reference
Clicking a binding displays the Service Instance Details page. |
| Binding Type | Shows the type of the binding on the service or reference. Supported Bindings are:
|
| Application | Shows the application to which the service or reference belongs |
| Environment | Shows the environment to which the parent application of the service or reference belongs |
| Hits | The total number of hits for the service or reference deployed on the selected node
This number includes hits to the service and to internal services if a virtual binding is used between TIBCO ActiveMatrix components. |
| Successes | The number of successful responses for the service or reference deployed on the selected node
This number includes successful responses for the service and internal services if a virtual binding is used between TIBCO ActiveMatrix components. |
| Faults | The number of faults encountered by the service or reference deployed on the selected node
This number includes faults encountered by the service and internal services if a virtual binding is used between TIBCO ActiveMatrix components. |
For more information about using tables, Working with Tables.
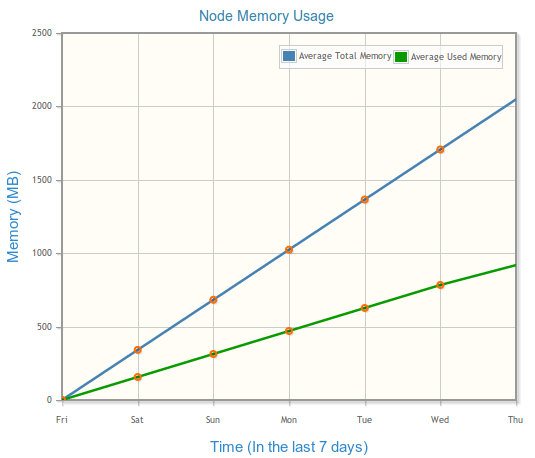
Node Memory Usage
The memory usage for the selected node is displayed in a graph on this page. The details about the Total Memory and Used Memory by the selected node are plotted on a graph where:
- X-axis represents the time period you select with the Time Range Selector
- Y-axis represents the memory in MB
If there is no data at a particular point of time, it is plotted on the chart as an orange circle.