Configuring a WMS layer and sublayer
After you have added a valid Web Map Service (WMS) layer, use its properties to fine-tune its display in the map chart visualization.
Prerequisites
Tip: Many WMS resources are available on the internet. The article
WMS sources for Spotfire on the
TIBCO Spotfire Community site lists many links to sites that contain WMS resources, both free and paid. (The TIBCO Community site is free to use; however, users must register an account to gain access to the information.)
Procedure
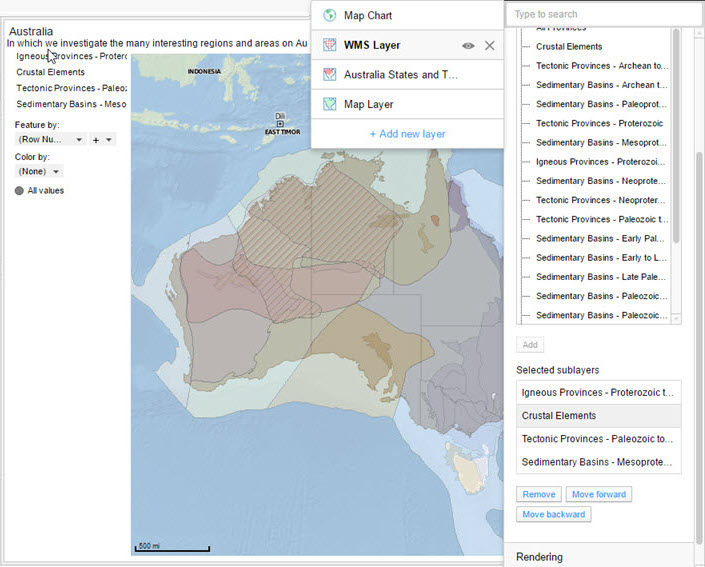
Example of configured WMS layer with sublayers
The Australian Geological Provinces WMS layer has many sublayers. In this image the following properties are set.
- The map chart Title and Description contain information about the visualization.
- The WMS layer is displaying the service from http://services.ga.gov.au/gis/services/Geological_Provinces_2013/MapServer/WMSServer?request=GetCapabilities.
- Appearance has been set to semi-transparent to display the country and territories under the WMS layer.
- Map displays the four selected sublayers (listed in the legend). The selected sublayers top-to-bottom listing corresponds to the forward-to-backward placement on the map chart visualization. Note that the sublayers are also displayed in the legend.
- The legend is displayed on the left side of the map chart visualization.
- The underlying feature layer displays state borders.
- The underlying map layer displays the coastline and ocean.
Rendering tips
On the Rendering properties page, you can change properties affecting how fast the map is rendered.
If your WMS server supports tile-base rendering, it will make the map load faster. However, tile-based rendering generates more calls to the WMS server, so if you have a limit on the number of requests, you can run the risk of reaching the limit and not being able to retrieve images from the server. To make the map load faster when the analysis is reopened, make sure to use the setting Cache images from WMS server. This will reduce the number of requests to the WMS server.
Copyright © Cloud Software Group, Inc. All rights reserved.