Sorting tiles by performance

You can sort the tiles in a KPI chart in 'Best first' or 'Worst first' order by measures that you specify per KPI. The sorting includes the tiles from all existing KPIs in the KPI chart.

This makes it possible to, for example, gather all tiles that show good performance at the very top of the chart by specifying a 'Best first' order.

Procedure

  1. Right-click the KPI you want to include in the sorting, and select Properties in the opened menu.
    The Properties pop-over is displayed.
  2. In the pop-over, select Sorting.
    The Sorting section is shown.
  3. Under Sort tiles by, specify which measure to use for sorting the tiles. You can
    • select a column and an aggregation in the column selector.
    • right-click the column selector and click Custom expression. This opens a dialog where you can type your own expression.
    Note: The sorting is only put in effect if the Best first or Worst first option is used. See the following steps.
  4. Repeat step 1 to 3 above until you have specified a sort order for each KPI you want to include in a Best first or Worst first sorting.
  5. Right-click the KPI chart to display the pop-up menu.
  6. Select Sort order > Best first or Sort order > Worst first.

Example

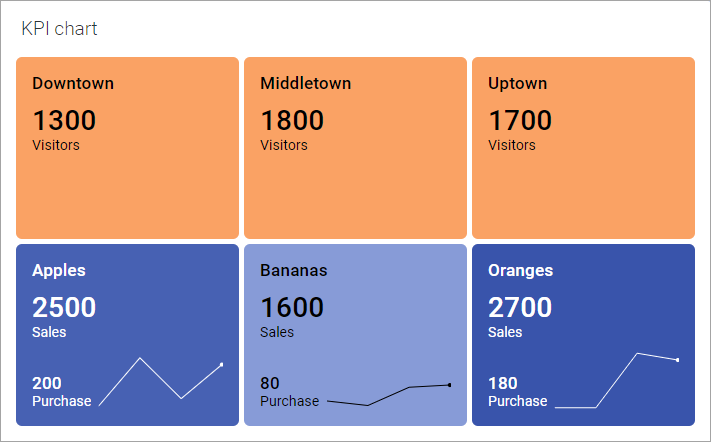
The KPI chart below contains two KPIs. The first KPI shows the number of visitors at different stores. The primary values in the tiles for this KPI are specified to be used for sorting, that is, on Sort tiles by, the Visitors column is selected.

The second KPI shows sales figures for different fruit types as primary values in the tiles, and purchase figures as the comparative values. Also in this KPI, the primary values are specified to be used for sorting, that is, on Sort tiles by, the Sales column is selected.


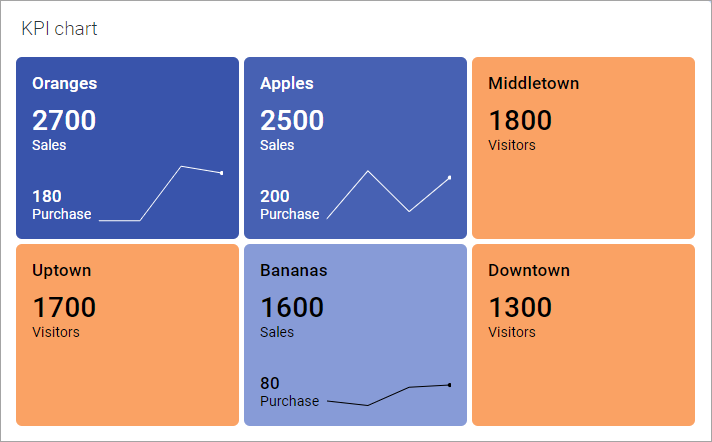
Sorting the tiles using the Best first order results in the KPI chart below. The primary values from both the KPIs are sorted starting with the highest value.