Creating a side-by-side bar chart
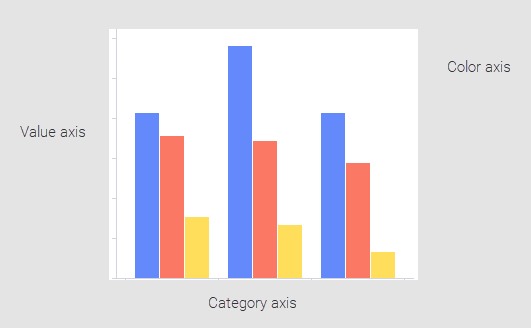
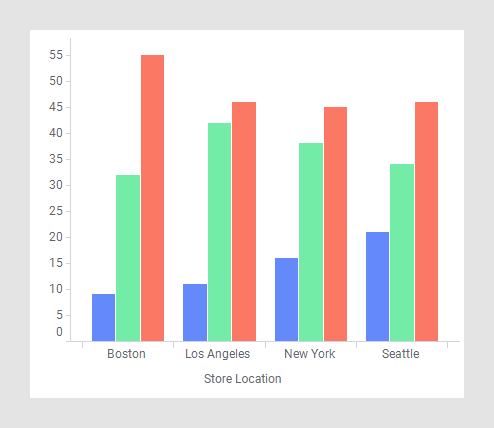
In a side-by side bar chart, the bars are split into colored bar segments. The bar segments are placed next to each other.

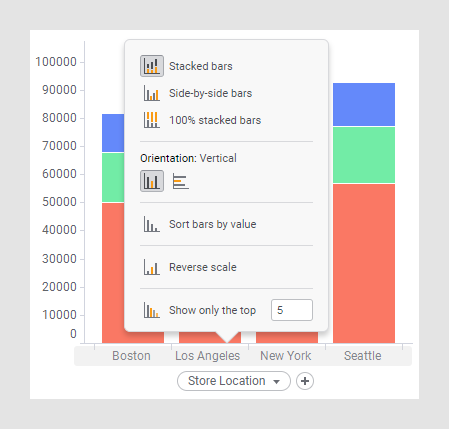
The bars in a bar chart can be split into colored segments as described in Creating a stacked bar chart. In a stacked bar chart, the bar segments within a category bar are placed on top of each other, and in a side-by-side bar chart, they are placed next to each other. Because they are placed next to each other you can easily compare their heights.
Procedure
Copyright © Cloud Software Group, Inc. All rights reserved.


