Using range filters
The range filter lets you filter to a range of values using a slider.
You can filter out values at both ends of the range, meaning that only rows with values within the chosen range remain in the visualization. Labels above the slider state the exact range.
An important feature of the range filter is that the values are distributed on a linear scale according to the values of the data. Thus, if values are unevenly distributed, this will be reflected in the range filter. Note that this is not the case with item filters, where values are distributed at even intervals along the range of the slider, regardless of the actual numeric values.
Procedure
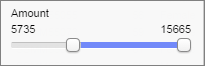
- Drag the left and right slider handles to change the lower and upper limits of the range.
-
Alternatively, double-click on a label, type the wanted end value, and press Enter.
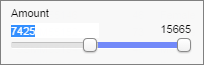
The labels show the lower and upper value of the range.
 to set start and end dates.
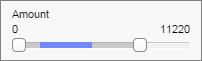
Moving the selected range sideways
The currently selected interval of the range filter can be grabbed and moved to pan the selected range - this provides a powerful way of sweeping over different "slices" of a data table. Click and drag the blue portion of the modified range slider to do this. Observing the reactions of the other sliders to such a sweep can give some interesting clues to correlation between parameters in the data table.