Adding annotations
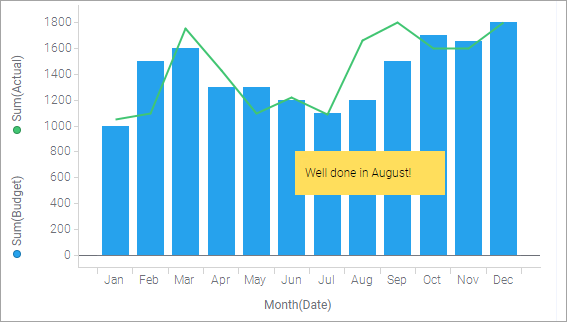
Annotations are text boxes that can be added on top of a visualization. You can annotate on visualizations for various presentation purposes like explaining what is displayed or informing of interesting findings. They can also be used for adding instructions or questions.
An annotation is a part of the visualization. This means that if you move an entire visualization to another position in the analysis, or duplicate it, any added annotations are included. If you export a visualization, you can specify whether to include the annotations.
The position of an annotation can be changed. You simply click the annotation and drag it within the visualization or to another visualization on the page.
Annotations can be hidden. You can either hide them totally or minimize them to icons.
 or
or
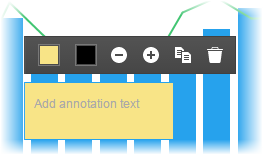
 to change the font size.