Confusion Matrix
Displays information about actual versus predicted counts of a classification model and helps assess the model's accuracy for each of the possible class values.

Information at a Glance
The Confusion Matrix Operator is a classification model evaluation operator similar to the Goodness of Fit evaluator, but it is more graphic in nature.
Algorithm
The Confusion Matrix operator is used to evaluate the accuracy of the predicted classifications of any Team Studio Classification Modeling algorithm, including the results of the Logistic Regression, Alpine Forest, Naive Bayes, Decision Tree, or SVM Operators.
The model performance is evaluated using the count of true positives, true negatives, false positives, and false negatives in a matrix. The following table shows the confusion matrix for a two-class classifier:
| Predicted | a is the number of correct predictions that an instance is negative, b is the number of incorrect predictions that an instance is positive, | |||
| Negative | Positive | |||
| Actual | Negative | a | b | c is the number of incorrect predictions that an instance is negative, and d is the number of correct predictions that an instance is positive. |
| Positive | c | d | ||
In the case of a 2-class classification model (for example), the Confusion Matrix operator calculates several standard accuracy terms.
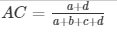


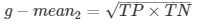
The accuracy determined using equation 1 might not be an adequate performance measure when the number of negative cases is much greater than the number of positive cases (Kubat et al., 1998). Suppose there are 1000 cases, 995 of which are negative and 5 of which are positive. If the system classifies them all as negative, the accuracy would be 99.5%, even though the classifier missed all positive cases.
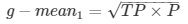
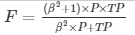
In equation 9, β has a value from 0 to infinity and is used to control the weight assigned to TP and P. Any classifier evaluated using equations 7, 8, or 9 has a measure value of 0, if all positive cases are classified incorrectly.
Input
Configuration
Confusion Matrix offers two possible configurations.
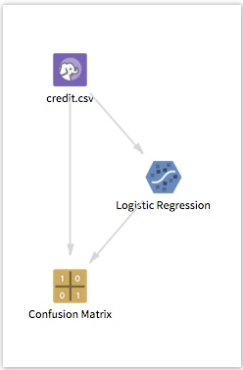
- Connect a classification model operator and a data set. In this configuration, the model scores the samples in the data set, and the Confusion Matrix summarizes the results. For Hadoop, this configuration is the only option, where the operator requires no configuration. For a database, for this configuration, you must set the Use Model parameter to true. With both a model and a data set connected, no parameters are necessary.
- The second configuration for database uses just an input table, with the prediction columns already present. In this case, set Use Model to false, and select the prediction columns to evaluate using the Prediction Columns input. With just a data set connect (on database) the following parameters apply.
Output
- Visual Output
- The Confusion Matrix produces both classification accuracy data and a graphical heat map.
- Classification Accuracy Data Table
-
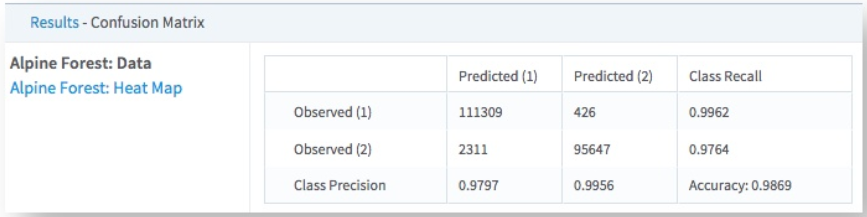
The data output provides the classification accuracy counts for every Observed/Predicted combination for each class.
In the following example, the intersection of the Observed (1) row and Predicted(1) column indicates that 111,309 predictions of value 1 were correct, while the Observed (1)/Predicted(2) cell indicates the model predicted 2 instead of 1 426 times. So for predicting the class of 1, the class recall was 99.62% correct. However, the Observed(2)/Predicted(1) cell indicates 2,311 instances of the model incorrectly predicting 1 for actual values of 2 and the Observed(2)/Predicted(2).
- Heat Map
-
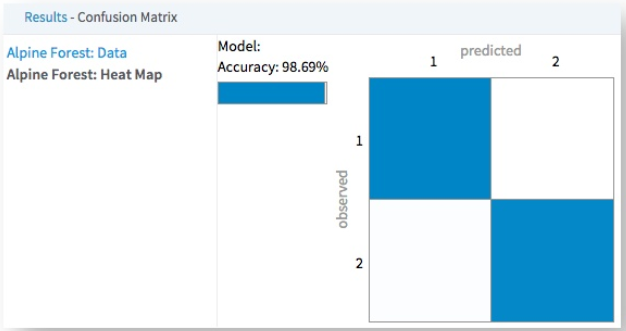
A Confusion Matrix Heat Map displays information about actual vs. predicted counts of a classification model.
The following example shows a Confusion Matrix Heat Map for a Logistic Regression model. In this case, it is evident that the model performs the best when predicting the value 0 with 99% accuracy. However, the accuracy drops for predicting the value 1, being correct only 10% of the time.