Visualizing data with charts and graphs
Data visualization is at its most effective when you know which visualization type gives you the best understanding of the data.
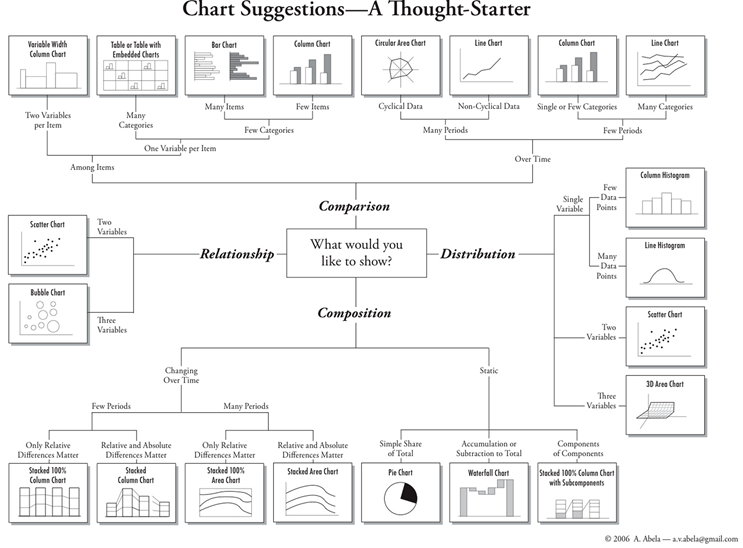
The following graphic shows the thought process that a data modeler can use to decide among all of the charts or graphs available for visualizing data. 1
1 Obtained from
http://extremepresentation.typepad.com/.a/6a00d8341bfd2e53ef00e553577fea8833-pi?goback=%2Egde_3490621_member_137236551
Copyright © Cloud Software Group, Inc. All rights reserved.