Variable Selection (DB)
Identifies and prioritizes the variables of interest to a prediction task or model. This is especially helpful when there are a large number of potential variables for a model, enabling the modeler to focus on only a subset of those that show the strongest relevance.
Information at a Glance
Algorithm
For database, there are three information gain-based scoring metrics for variable selection: Information Gain, Information Gain Ratio, and Transformed Information Gain. For numerical columns, we discretize them. We recommend a preliminary threshold of the variables by comparing their scores to a random benchmark.
- Information Gain
-
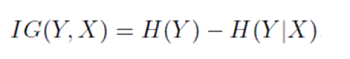
Information Gain is a measure of the change in the entropy (or uncertainty) of a random variable Y when it is conditioned on another (categorical) variable X. In our case, Y is the class to be predicted (the dependent variable), and X is a candidate driver.
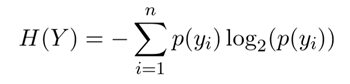
The entropy of a categorical random variable Y with n possible values (classes) is given by
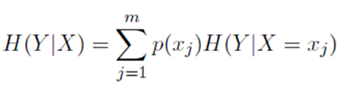
The conditional entropy of Y given the values of a discrete variable X that takes on the m values is given by
The information gain about Y, given that we know X measures how much more we know about Y because we know X:
- Information Gain Ratio
-
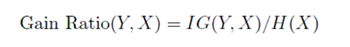
The standard way to adjust for the biases of information gain is to normalize by the entropy of X. This is called the Information Gain Ratio.
- Transformed Information Gain
-
Another way to adjust for bias is to map all candidate features into the same number of classes.
For binary output variables, we can create a simple predictor from each candidate feature, and then measure the information gain in Y, given the simple predictions from X.
One way to build a simple predictor is as follows:
This transforms the variable X to the simple predictor, which takes on the same number of classes as Y. The score for X is now given by IG(Y, "simple predictor").
- Score Threshold by Chance
-
Score threshold by chance is a score we can get just by chance, even if X is not truly predictive of Y. We generate X that are designed to be independent of Y according the distribution of Y and then calculate the score. We can generate a lower-bound threshold T. Any candidate feature that scores lower than T is almost certainly not predictive of the output variable, and can be eliminated. In practice, T is quite small, and probably does not eliminate too many variables. However, it still gives a useful sense of scores that correspond to meaningful and less-meaningful variables.
- Handling numerical columns with Information Gain
-
In a database, we approximate the probability density of continuous/numerical X by histograms. To do this, we bin X into a fairly large number of discrete classes, and then use the equation up, or the transform technique to calculate the scores.