Association Rules
Association Rules modeling refers to the process of determining patterns that occur frequently within a data set, such as identifying frequent combinations or sets of items bunched together, subsequences or substructures within the data.
Input
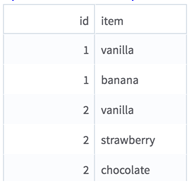
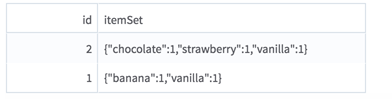
An HDFS tabular data set with a sparse item set (or "basket") column (key/value dictionary with distinct items as keys and frequency as values).
The input is most likely to be generated by the Collapse operator, using the transaction ID column(s) in a Group By clause and the item column in the Columns to Collapse check boxes. See the example for an illustration.
- Bad or Missing Values
- If the Item Set Column selected column has null values in the Item Sets Column selected, the rows are removed from the data set. The number of null values removed can be listed in the Summary section of the output (depending on the chosen option for Write Rows Removed Due to Null Data To File). If the Item Set Column selected has bad key/values pairs in the dictionary, the operator fails at runtime with a meaningful error message.
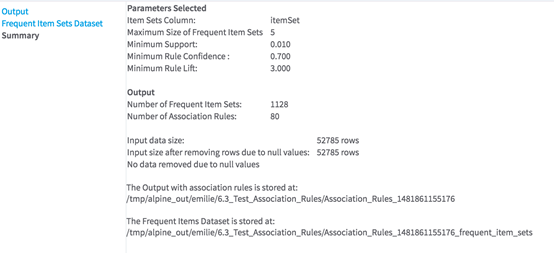
Configuration
| Parameter | Description |
|---|---|
| Notes | Any notes or helpful information about this operator's parameter settings. When you enter content in the Notes field, a yellow asterisk is displayed on the operator. |
| Item Set Column |
Select the dictionary column that represents the item set (or "basket") for each transaction (ID,
group...).
Data type supported: Team Studio Sparse This column is most likely to be the output column of the Collapse operator (see the Input section, above). |
| Maximum Size of Frequent Item Sets | Specify the maximum number of items a frequent item set can contain in order to be used to generate association rules. The range of possible values is between 1 and 50. Default value: 5. |
| Minimum Support | Support of an association rule is the percentage of groups that contain all of the items listed in the Association Rule. Minimum Support specifies the lower threshold percentage of groups or transactions that contain all of the items listed for the association rule. |
| Minimum Rule Confidence |
The Confidence of an Association Rule is a percentage value that shows how frequently the rule head occurs among all groups that contain the rule body. The Confidence value indicates how reliable this rule is. The higher the value, the more often this set of items is associated together. Minimum Confidence specifies the lower percentage threshold for the required frequency of the rule occurring. For a rule X => Y :
|
| Minimum Rule Lift |
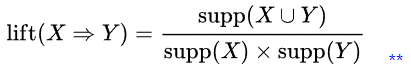
The Lift of an Association Rule is the ratio of the observed support for the rule ( = support (XUY) ) to that expected if X and Y were independent. If a rule has a lift of 1, it implies that the probability of occurrence of the antecedent X and that of the consequent Y are independent of each other. When 2 events are independent of each other, no rule should be drawn involving those two events. If the lift is > 1, that lets us know the degree to which those two occurrences are dependent on one another, and makes those rules potentially useful for predicting the consequent in future data sets. The value of lift is that it considers both the confidence of the rule and the overall data set.
|
| Write Rows Removed Due to Null Data To File |
Rows with null values in Item Sets Column are removed from the analysis. This parameter allows you to specify that the data with null values be written to a file. The file is written to the same directory as the rest of the output. The filename is bad_data.
|
| Storage Format | Select the format in which to store the results. The storage format is determined by your type of operator.
Typical formats are Avro, CSV, TSV, or Parquet. |
| Compression | Select the type of compression for the output.
Available Avro compression options. |
| Output Directory | The location to store the output files. |
| Output Name | The name to contain the results. |
| Overwrite Output | Specifies whether to delete existing data at that path. |
| Advanced Spark Settings Automatic Optimization |
|
 . **
. **
 means the support of the union of the items in
X
and
Y. This is somewhat confusing, since we normally think in terms of probabilities of events and not sets of items. We can rewrite
means the support of the union of the items in
X
and
Y. This is somewhat confusing, since we normally think in terms of probabilities of events and not sets of items. We can rewrite
 where
where
 and
and
 are the events that a transaction contains itemset
 and
and
 , respectively.
Outputs
- Visual Outputs
-
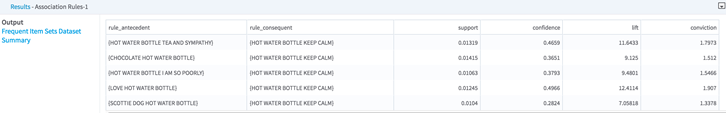
- Association Rules
Output (the main output transmitted to subsequent operators). An example is shown here.
It displays the rules selected from the user's specified criteria, with the related measures of significance of these rules:
- Support (see Parameter section - Minimum Support)
- Confidence: (see Parameter section - Minimum Rule Confidence)
- Lift: (see Parameter section - Minimum Rule Lift)
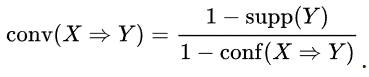
- Conviction: The conviction of a rule can be interpreted as the ratio of the expected frequency that X occurs without Y (that is, the frequency that the rule makes an incorrect prediction) if X and Y were independent, divided by the observed frequency of incorrect predictions. For example, if a rule (X => Y) has a conviction of 1.2, it means that this rule would be incorrect 20% more often (1.2 times as often) if the association between X and Y was purely random chance. The higher conviction is, the more reliable the rule is.
- Association Rules
Output (the main output transmitted to subsequent operators). An example is shown here.
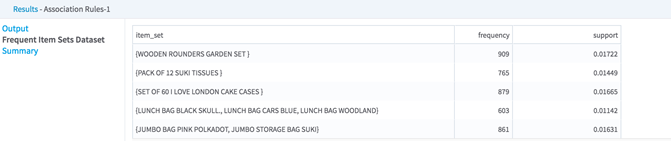
- Data Output
-
The output of this operator is the Association Rules data set that can be further filtered out based on rule metrics (for example, using a Row Filter).