Frequency
Analyzes the values of selected fields in a table, helping to interpret the shape of the data column by column.

Algorithm
Frequency Analysis provides statistics on the distinct values of the data, including the count and percentage of each value of a column.
Configuration
| Parameter | Description |
|---|---|
| Notes | Any notes or helpful information about this operator's parameter settings. When you enter content in the Notes field, a yellow asterisk is displayed on the operator. |
| Columns | Click Select Columns to select the available columns from the input data set for analysis. For more information, see Select Columns Dialog Box. |
Output
- Visual Output
-
- Counts
- Displays the shape analysis graph for the count of each distinct value of the selected data column (name) for analysis. View the Frequency results of any analyzed column by selecting the column from the name drop-down list.
Important: To learn more about the visualization available in this operator, see Exploring Visual Results.
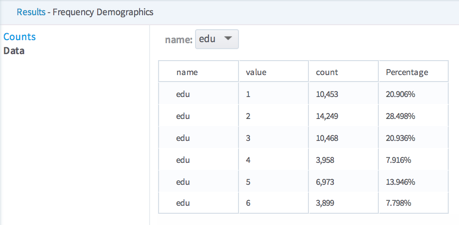
- Data
- Displays the column name, value, count, and frequency percentage for each selected column (name), as shown in the following example:
- Data Output
- None. This is a terminal operator.

Copyright © Cloud Software Group, Inc. All rights reserved.