K-Means Clustering - MADlib
Team Studio supports the MADlib K-Means Clustering model implementation.

Algorithm
Clustering refers to the problem of partitioning a set of objects according to some problem-dependent measure of similarity. In the k-means variant, one is given n points, and the goal is to position k centroids so that the sum of distances between each point and its closest centroid is minimized. Each centroid represents a cluster that consists of all points to which this centroid is closest.
In the most common case, the distance measure used is the square of the Euclidean distance.
This problem is computationally difficult (NP-hard), yet the local-search heuristic proposed by Lloyd [1] performs reasonably well in practice. In fact, it is so ubiquitous today that it is often referred to as the standard algorithm or even just the k-means algorithm. It works as follows:
Since the objective function decreases in every step, this algorithm is guaranteed to converge to a local optimum.
More information can be found in the Official MADlib documentation page.
Input
- Non-numeric variables in the input data set must first be transformed and scaled or normalized before the clustering can take place.
- Numeric variables can be normalized as well.
- Depending on the chosen transformations, normalizations, and distance calculations, certain variables may dominate clustering results or may be completely ignored.
Configuration
| Parameter | Description |
|---|---|
| Notes | Any notes or helpful information about this operator's parameter settings. When you enter content in the Notes field, a yellow asterisk is displayed on the operator. |
| MADlib Schema Name | The schema where MADlib is installed in the database. MADlib must be installed in the same database as the input data set.
If a madlib schema exists in the database, this parameter defaults to madlib. |
| Model Output Schema Name | The name of the schema where the output is stored. |
| Model Output Table Name | The name of the table that is created to store the model. The model output table stores:
centroids | objective_fn | frac_reassigned | num_iterations For more information, see the official MADlib k-means documentationn. |
| Drop If Exists | |
| Centroid Seeding | Centroid seeding can be done in three ways:
|
| Centroid Source | If Centroid Seeding is set to user-defined, set the input table for the centroid source. |
| Centroid Column | If Centroid Seeding is set to user-defined, set the column in the input table specified by Centroid Source for the centroid column. |
| Points Column | The
Points column in the input data set contains the array of attributes for each point.
This parameter must be an array type. |
| K | Specifies the number of clusters to create during the cluster analysis process.
|
| Distance Function | Calculates the difference between the cluster member's values from the cluster's centroid (mean) value. The distance can be calculated in the following different ways:
Cosine - Measures the cosine of the angle between two vectors. For
n dimensional vectors
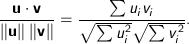
Euclidean - The square root of the sum of the squares of distances along each attribute axes. For
n dimensional vectors
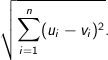
Manhattan - The Manhattan, or taxicab, metric measures the distance between two points when traveling parallel to the axes. For
n dimensional vectors
Squared Euclidean (the default) - The default method for calculating the straight line distance between two points. It is the sum of the squares of distances along each attribute axes. For
n dimensional vectors
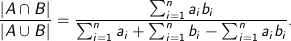
Tanimoto - Measures dissimilarity between sample sets. It is complementary to the Jaccard coefficient and is obtained by subtracting the Jaccard coefficient from 1, or, equivalently, by dividing the difference of the sizes of the union and the intersection of two sets by the size of the union. As with Dice similarity, 0-1 vectors are used to represent sets. Then the Jaccard Similarity of sets A and B represented by set-vectors
User defined - Specified by the user. See User-Defined Distance. |
| User-Defined Distance | If, for
Distance Function, you specify
User-defined, provide the function.
The modeler might try to start with the default Squared Euclidean method, then experiment with the various other calculation methods to determine whether the cluster results seem more intuitive or provide more business insight. |
| Aggregation of Centroid | Defines how cluster centroid positions should be calculated using the points assigned to the same cluster. The options are average (the default) or normalized average. |
| Maximum Iterations | The number of iterations required before computation stops. When the number of iterations is greater than the Maximum Iterations, or when the fraction of reassigned points is below the Minimum Fraction Reassigned, computation stops. |
| Mini Frac Reassigned | The minimum fraction of reassigned points required before computation stops. When the number of iterations is greater than the Maximum Iterations, or when the fraction of reassigned points is below the value of Mini Frac Reassigned, computation stops. |
 and
and
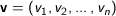 , it is calculated using the dot product formula as:


 and
and
 is given by:
Output
- Visual Output
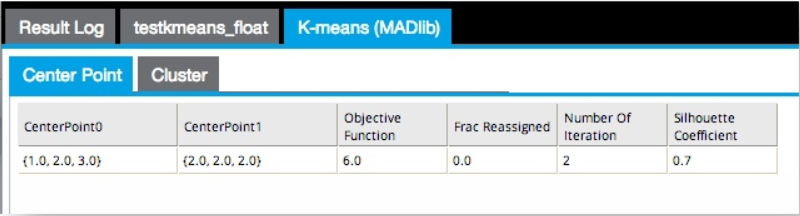
- The K-Means Clustering (MADlib) operator outputs
Center Point and
Cluster tabs.
The Center Point results tab displays the cluster centroid positions, objective function value, fraction of reassigned points in the last iteration, number of total iterations, and the simple silhouette coefficient - a popular method to assess the quality of the clustering (the closer to 1, the better the clustering).
- Data Output
- You can send output only to a K-means Predictor operator.
Additional Notes
- References
-
[1] Lloyd, Stuart: Least squares quantization in PCM. Technical Note, Bell Laboratories. Published much later in: IEEE Transactions on Information Theory 28(2), pp. 128-137. 1982.
[1] David Arthur, Sergei Vassilvitskii: k-means++: the advantages of careful seeding, Proceedings of the 18th Annual ACM-SIAM Symposium on Discrete Algorithms (SODA'07), pp. 1027-1035,http://ilpubs.stanford.edu:8090/778/1/2006-13.pdf