K-Means (HD)
K-Means configuration is a data set that contains the various attribute values of the data members to use as clustering or partitioning criteria.

Information at a Glance
For more information about using K-Means, see Cluster Analysis Using K-Means.
Algorithm
The K-Means Operator algorithm works to make the objects within a cluster "similar" to one another and "dissimilar" to members of the other clusters in terms of their attributes. In order to achieve this, K-Means employs a centroid-based partitioning technique that uses the centroid of a cluster to represent that cluster. Conceptually, the centroid of a cluster is its center point.
The Team Studio K-Means Operator defines the centroid as the mean of the attribute values for members within the cluster. The difference between a cluster member and the centroid is used to determine the quality of the cluster model. Note: the distance can be measured in different ways, with the default being the Euclidean distance between two points. Specifically, the algorithm calculates a within-cluster variation value, which is the sum of the squared distance between all members of the cluster and the centroid of the cluster.
The overall K-Means algorithm's objective is to make the k clusters for a data set to be as compact (smallest within-cluster variation) and separate (minimal overlap) from each other as possible. In other words, the algorithm aims for high intracluster similarity and low intercluster similarity, across the various attribute dimensions included in the model.
The K-Means algorithm works as follows.
- k random points from the data set are chosen as the initial centroids of the k clusters.
- k clusters are created by associating each observation to the nearest centroid.
- The new centroids are calculated for the clusters; determine whether centroid values change coordinates.
- Steps 2 and 3 are repeated until convergence (when the centroid values do not change) or a specified termination criterion is met.
Input
Non-numeric variables in the input data set must first be transformed and scaled or normalized before the clustering can take place. Numeric variables can be normalized as well. Depending on the chosen transformations, normalizations, and distance calculations, certain variables might dominate clustering results or might be completely ignored.
Configuration
| Parameter | Description |
|---|---|
| Notes | Any notes or helpful information about this operator's parameter settings. When you enter content in the Notes field, a yellow asterisk is displayed on the operator. |
| Columns | Specifies the various attributes (that is, data columns) to consider during the cluster analysis. At least one column must be specified.
Click Columns to open the dialog box for selecting the available columns from the input data set for analysis. |
| Number of Clusters | The number of clusters to determine from the data for the k-means analysis.
Default value: 3. |
| Maximum Optimization Steps | Specifies the maximal number of iterations performed for one run of the k-means algorithm.
A warning message displays in the results if the k-means analysis has not converged within the Maximum Optimization Steps. If this occurs, try increasing this value. Default value: 10. |
| Tolerance | This value is similar to the epsilon value on Logistic Regression and Linear Regression. The lower the value is set (closer to 0), the stricter we are about when we say the analysis has converged. A smaller number results in more iterations of the algorithm, but it is still capped by the iteration limit.
Default value: 1.0E-4. |
| Use Spark | If Yes (the default), uses Spark to optimize calculation time. |
| Advanced Spark Settings Automatic Optimization |
|
Output
- Visual Output
-
For data sets with 1000 or fewer columns, the K-Means Operator results are displayed across multiple sections.
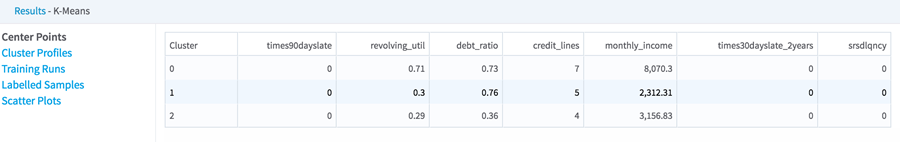
- Center Points - Displays a results table with the various mean distance from centroid measurements for each of the Variables, per cluster:
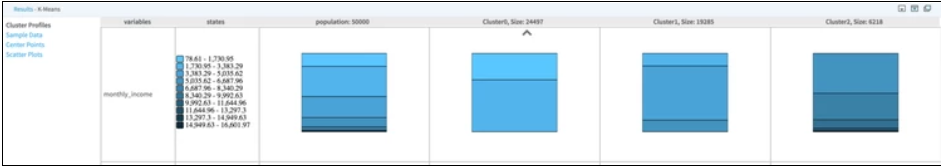
- Cluster Profiles - Provides a overall sense of how the data is partitioned into clusters.
It displays a table with a row for each attribute (that is, variable) used in the cluster analysis. For each variable, the following results are provided:
- States: specify how the variable's numeric value was split or stratified into the specified Number of Splits groups. Note: this acts as a "legend" for understanding how each cluster's members are distributed across the possible value ranges.
- Population: specifies the number of overall data rows analyzed and shows the overall breakdown of the data set across the states for each particular variable.
- Cluster 0…K: for each of the K clusters created, a column shows the breakdown of the cluster members across the various states for each particular variable. Note: the size of each cluster (that is, number of members) is displayed at the top of the Cluster columns.
Note: When analyzing the K-Means Cluster Profile results tab, the modeler should look for:- Each variable having different distribution patterns per cluster. This shows that, for that variable, the clusters have distinct characteristics and therefore, implies a successful K-Means analysis.
- Distortions in the cluster size relative to one another might highlight interesting conclusions, such as showing a dominant group for targeting specific marketing.
- Clusters that have distinct characteristics might help target specific conditions for research.
- Training Runs - The
Run section shows what run of the algorithm is displayed. If you only chose one run, only one row is visible here.
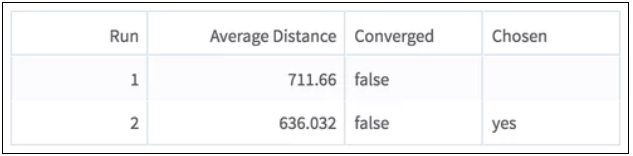
Average Distance refers to the average Euclidean distance for each sample to the centroid in its cluster.
A run has 'converged' if two iterations produce practically the same model (the difference is less than the convergence threshold, or tolerance). If it doesn't converge, the algorithm continues up to the allotted amount of iterations.
We choose the model with the smallest Average Distance to show you results.
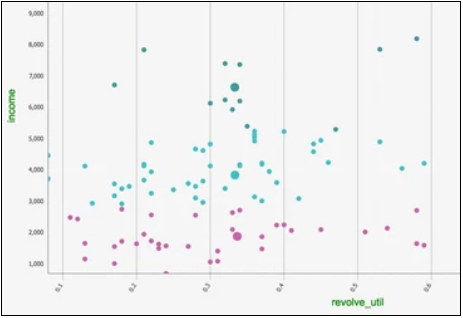
- Scatter Plots - The
Cluster results tab displays a Cluster graph, which is a visualization of each cluster's member values based on two of the variable dimensions used for the K-Means analysis.
Although there is typically some overlap between members of the clusters, the goal is to minimize the overlap of clusters, as illustrated in the example above. For a perfect cluster analysis model, there would be zero overlap between the clusters for each variable analyzed.
The output can only be displayed two dimensions at a time. Therefore, the modeler needs to review all the possible clustering diagrams in order to get an overall assessment of which attribute dimensions have the greatest influence on the clustering. Note: the Cluster Profiles results tab provides a quick sense of which variables have the most unique distribution profile across clusters, so those variables would be good ones to further analyze in this Cluster graph section.
Cluster graphing can be toggled on/off per cluster. Therefore, the graph can be viewed showing one cluster at a time, which helps understand just the spread of members per cluster and visually see their distance from their center, as in the following example, which shows three visually distinct clusters with a clear separation of the three center points for each cluster.
A lot of "cluster overlap" for two variables might indicate that they are not as significant in the cluster analysis, or that there is not much variation of the overall population for those particular variables.
Another cause of "cluster overlap" might be that the variable values were not appropriately normalized before the analysis was run.
- Data Output
- A model output that must be connected to a Predictor operator to produce a data set output. It can also be exported in PFA and AM format along with PMML.