Chi Square, Goodness of Fit
Computes a Pearson's Chi Square test for goodness of fit of a distribution.

Information at a Glance
For more information, see Pearson's Chi Square. See Pearson's Chi Square Operations for information about the Chi Square operators.
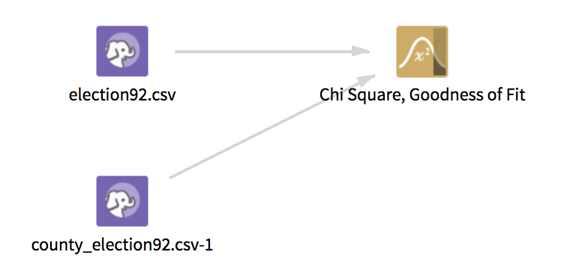
Input
This operator requires two inputs: a data set that contains the observed events and their frequency, and a data set that represents the expected frequency of the events. Both data sets should have a categorical column that represents event names and a numeric column with the frequency of events. Frequencies must be absolute frequencies (using relative frequencies - ratios - results in an inaccurate statistic).
The following inputs (pre-aggregated or not) are considered valid (in other words, the frequencies for a unique category can be split into multiple rows that are aggregated at runtime).
The two input data sets, the expected frequencies and the observed frequencies, do not need to have the exact same data format, but they should correspond to the same distinct events, because the chi square statistic is a pairwise comparison between observed and expected frequency for the each event outcome.
- Bad or Missing Values
- Missing or null values must be removed from both the even name and event frequency column in each of the two input data sets. If rows are removed in this step, then they are reported in the Summary tab of the visual output. Depending on the selected value of the Write Rows Removed Due to Null Data To File parameter, the rows removed due to null data in either of the data sets can be written to a file.
Restrictions
This operator can accept any two data sets that each have a numeric and categorical column. However, the results are not meaningful unless the categorical columns in the two data sets contain corresponding event names and the numeric columns represent absolute frequencies. For example, frequencies should be non negative and the frequencies in one data set should be (aggregated or not) counts of events.
Configuration
| Parameter | Description |
|---|---|
| Notes | Any notes or helpful information about this operator's parameter settings. When you enter content in the Notes field, a yellow asterisk is displayed on the operator. |
| Observed Dataset | The name of the input data set (both the input data sets appear in the drop-down) that corresponds to the observed frequencies. |
| Observed Events Column | The event names column in the observed data set selected above. This should be a categorical column. The events might occur more than once in the columns. |
| Observed Frequency Column | A column in the observed data set with a measure of absolute frequency of the events. |
| Expected data set | The second data set, which represents the theoretical expected frequencies of the events in the observed data set. |
| Expected Events Column | The event names column in the specified Expected data set. This column should be a categorical column. The events can occur more than once in the column. In this case, the frequency is the sum of the frequencies of the events with the same name scaled by the sum of all the frequencies. The events in the observed events column should correspond with the events in the expected column. The analysis can be completed only on events that appear in both data sets. |
| Expected Frequency Column | The absolute frequency of each event in the expected events column. |
| Significance Threshold | The confidence level under which the null hypothesis is rejected. Practically, this value is used to determine the Reject Null Hypothesis column in the output. We reject the null hypothesis if the P-Value (which represents the probability that the variance in the event distributions occurred due to chance) is less than this value. |
| Write Rows Removed Due to Null Data To File | Rows with null values in the event name or frequency columns are removed from each of the input data sets. This parameter allows you to specify that the data with null values are written to a file. The parameter applies to null values in both of observed and expected input data set.
Null data in the observed data set is written to the following location: @default_tempdir/tsds_out/@user_name/@flow_name/@operator_name_uuid_bad_data_observed Null data in the expected data set is written to the following location: @default_tempdir/tsds_out/@user_name/@flow_name/@operator_name_uuid_bad_data_expected
|
| Storage Format | Select the format in which to store the results. The storage format is determined by your type of operator.
Typical formats are Avro, CSV, TSV, or Parquet. |
| Compression | Select the type of compression for the output.
Available Avro compression options. |
| Output Directory | The location to store the output files. |
| Output Name | The name to contain the results. |
| Overwrite Output | Specifies whether to delete existing data at that path. |
| Advanced Spark Settings Automatic Optimization |
|
Output
- Visual Output
-
This operator produces the following three tabs of visual output.
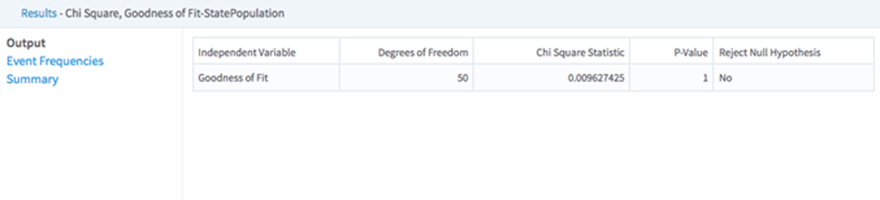
- Output - Shows a preview of the output that is passed to the next operator. The output is the results of the Chi Square goodness of fit test. The structure of this output is the same as the Chi Square, Independence Test Operator; however, the degrees of freedom correspond to the number of event outcomes and there is only one independent variable.
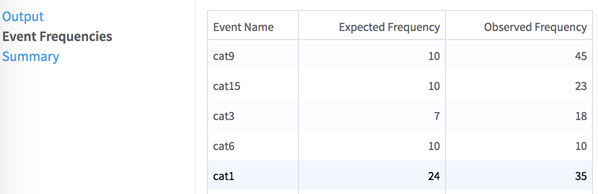
- Event Frequencies - Displays a table of the scaled frequencies for the events in both of the data sets. Notice that only events which appear in both the observed and expected data set are included in this table. If events are dropped during the join, a message that lists the first ten of these events appears in the logs. This is the table that forms the basis of the Chi Square analysis.
- Summary - Like most of the Team Studio transformation operators, this operator contains a summary tab that provides the location of the results on HDFS and reports if any rows are dropped due to null values. In the case of this operator, we report rows dropped for both the Expected data set input and the Observed data set input. The exact format of the bad data reporting is controlled by the Write Rows Removed Due to Null Data To File parameter.
- Output - Shows a preview of the output that is passed to the next operator. The output is the results of the Chi Square goodness of fit test. The structure of this output is the same as the Chi Square, Independence Test Operator; however, the degrees of freedom correspond to the number of event outcomes and there is only one independent variable.
- Data Output
- The Results of the Chi Square test (previewed in the Output tab of the visual results) are passed to succeeding operators. The results are a tabular data set and can connect to any Hadoop operator that expects tabular input.