T-Test - Independent Samples
Computes a test of statistical significance against a student's t-distribution for one measure across two different groups.

Information at a Glance
| Category | Model Validation |
| Data source type | HD |
| Sends output to other operators | Yes |
| Data processing tool | Spark |
The independent samples t-test is used to test whether two groups are significantly different for the same measure.
For information about Student's t-distribution, see https://en.wikipedia.org/wiki/Student%27s_t-distribution
Algorithm
The means and variances for all of the test statistics are computed using Spark's MultivariateStatisticalSummary object, but the t-tests themselves are computed from Java's commons-math library.
Configuration
| Parameter | Description |
|---|---|
| Notes | Any notes or helpful information about this operator's parameter settings. When you enter content in the Notes field, a yellow asterisk is displayed on the operator. |
| Values | A numeric column that contains the sample values. |
| Columns to Test | Specify the columns to test. |
| Column To Group By | A categorical column used to separate the two samples. |
| First Group Value (appears in group by column) | The name of the group for the first sample. This must be a value in the Column to Group By list. |
| Second Group Value (appears in group by column) | The name of the group for the second sample. This must be a value in the Column to Group By list. |
| Sample Means Have Equal Variance (Homoscedastic T-Test) | Specify whether to use a homoscedastic t-test (No or Yes). |
| Write Rows Removed Due to Null Data To File |
Rows with null values are removed from the analysis. This parameter allows you to specify that the data with null values be written to a file.
The file is written to the same directory as the rest of the output. The filename is suffixed with _baddata.
|
| Advanced Spark Settings Automatic Optimization |
|
| Storage Format | Select the format in which to store the results. The storage format is determined by your type of operator.
Typical formats are Avro, CSV, TSV, or Parquet. |
| Compression | Select the type of compression for the output.
Available Avro compression options. |
| Output Directory | The location to store the output files. |
| Output Name | The name to contain the results. |
| Overwrite Output | Specifies whether to delete existing data at that path. |
Output
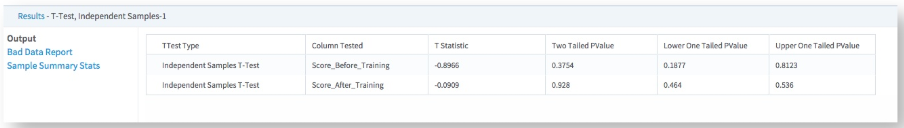
- Visual Output
- See
Independent Samples T-Test Use Case for example data on a puppy training program that illustrates use of the independent samples t-test. The results contain one row for each column selected in the
Sample Columns parameter. In this case we see that the puppies that Jenny trained do not perform significantly differently than those that Rachel trained either before or after training, because none of the p-values are close to zero.
- Data Output
-
- T Statistic - A value computed based on the average and variance. The higher the magnitude of the t-statistic, the higher the difference between the means.
- Two Tailed PValue - The sum of the area under the Students t-distribution above the absolute value of the t-statistic and below the inverse of the t-statistic. A higher value indicates a greater absolute difference in the sample compared. The null hypothesis is usually rejected if p < 0.05.
- Lower One Tailed PValue - The area under the Student's t-distribution between negative infinity and the t statistic. A lower p-value indicates that sample a is less than sample b. The null hypothesis is usually rejected if p < 0.05.
- Upper One Tailed PValue - The area under the Student's t-distribution between positive infinity and the t statistic. A lower p-value indicates that sample a is greater than sample b. The null hypothesis is usually rejected if p < 0.05.