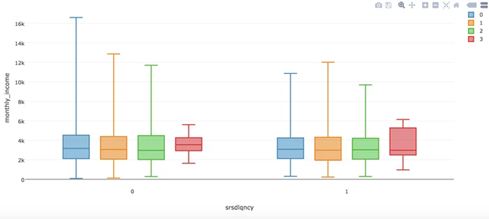
Box Plot
Visualizes the attributes of a data set in box plot format.
Information at a Glance
Use this operator to create a graphical representation of a data set's attributes using the box-and-whisker diagrams.
The Box Plot operator allows you to choose the following three attributes (columns) in the data table:
- X dimension (Analysis Type) - Accepts a category-type attribute to construct the box plot's X-axis.
- Y dimension (Analysis Value) - Accepts a numerical attribute to construct the box plot's Y-axis.
- Grouped dimension (Analysis Series) - Accepts a category-type attribute, which is shown in diagrams of different colors.
Configuration
Copyright © Cloud Software Group, Inc. All rights reserved.


