Correlation (HD)
Use to specify two or more numeric type attributes (columns) in a data set for relative analysis against each other by calculating the correlation between each pair of selected columns.

Information at a Glance
Algorithm
The covariance between two variables (X and Y) is calculated as shown in the following formula:
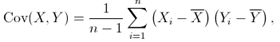
where
 and
and
 are the mean values for
X and
Y, respectively.
are the mean values for
X and
Y, respectively.
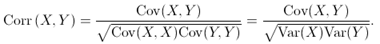
The correlation is calculated by normalizing the covariance, as shown in the following formula:
For information about correlation and covariance, and the algorithms that describe them, see Correlation and Covariance.
Configuration
| Parameter | Description |
|---|---|
| Notes | Any notes or helpful information about this operator's parameter settings. When you enter content in the Notes field, a yellow asterisk is displayed on the operator. |
| Columns | The numeric columns for which the correlation or covariance should be calculated. |
| Group by | When you select one or more group-by columns, the operator calculates a separate correlation (or covariance) matrix for every combination of values in the group-by columns. You can select one or more group-by columns. |
| Calculate | Specify whether to calculate the
Correlation (the default) or the
Covariance.
Correlation is normalized covariance, scaled so that the correlation between any variable and a positive multiple of itself is always 1. |
| Store Results? | Specifies whether to store the results. |
| Results Location | The HDFS directory where the results of the operator are stored. This is the main directory, the subdirectory of which is specified in Results Name. Click Choose File to open the Hadoop File Explorer Dialog Box and browse to the storage location. Do not edit the text directly. |
| Results Name | The name of the file in which to store the results. |
| Overwrite | Specifies whether to delete existing data at that path and file name. |
| Storage Format | Select the format in which to store the results. The storage format is determined by your type of operator.
Typical formats are Avro, CSV, TSV, or Parquet. |
| Compression | Select the type of compression for the output.
Available Avro compression options. |
| Advanced Spark Settings Automatic Optimization |
|
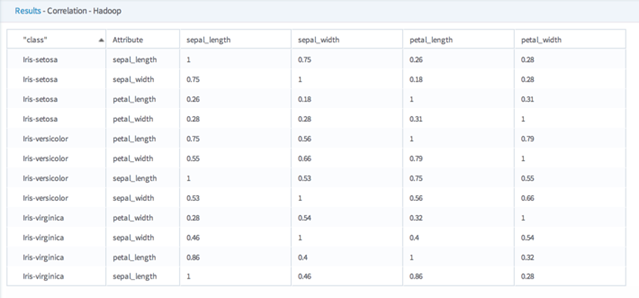
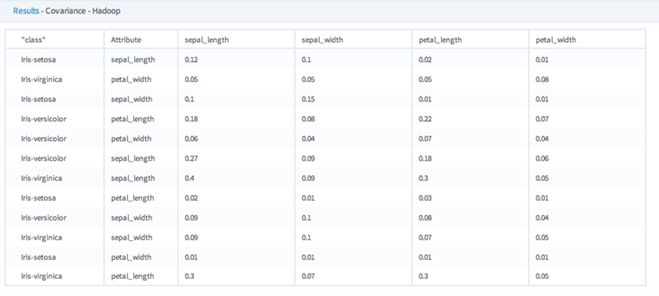
Example
The following example shows both the Hadoop correlation matrix and the corresponding covariance matrix output for different group by classes of Iris flowers. Note that when the correlation attribute is compared to itself, the resulting correlation coefficient value is 1 (this is not the case for the covariance data).