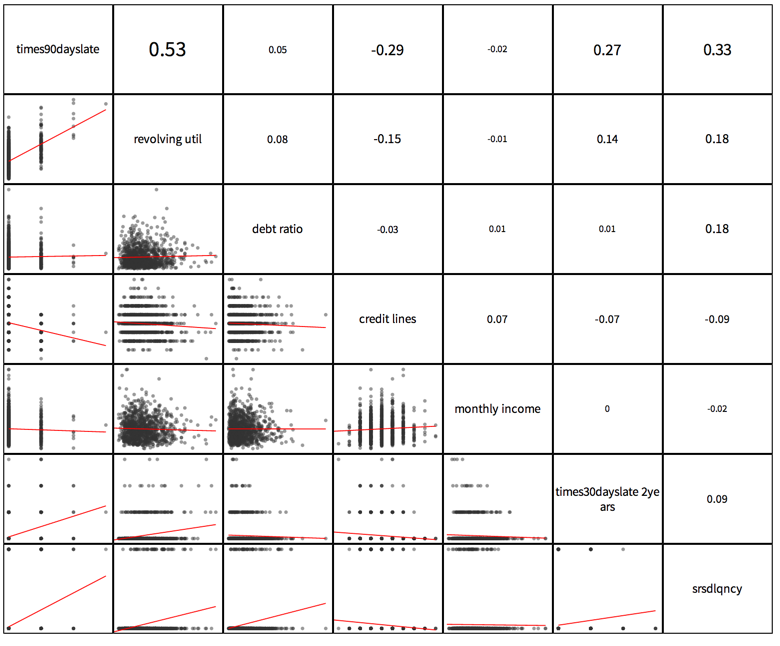
Scatter Plot Matrix
Creates pairwise scatter plots of the selected columns. This gives a visual sense of the relationship between each of the paired attributes, as well as the calculated correlation.

Configuration
Output
- Visual Output
- A matrix of the generated scatter plots based on the various pairs of selected data columns (variables). The plotted points are selected randomly from the input data set. The correlations are computed based on the entire data set, not on the sample points.
Double-click a small scatter plot to display a full size scatter plot.
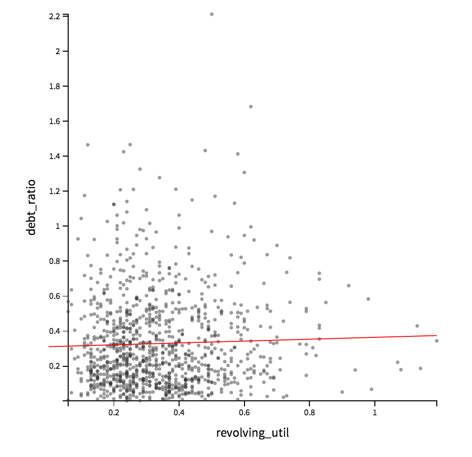
Note: For more information about the full-size scatter plot visualization, see Exploring Visual Results. - Data Output
- None. This is a terminal operator.
Copyright © Cloud Software Group, Inc. All rights reserved.